
Nestlé is one of the largest food and beverage companies in the world. With hundreds of products across multiple categories, managing such a big portfolio can be a challenge. That’s where strategic tools like the BCG Matrix come in.
In this blog, we’ll look at Nestlé’s products using the BCG Matrix. This analysis will help us understand which products are performing well, which need more investment, and which may not be profitable for the company in the long run.
About Nestlé
Nestlé was founded in 1866 and is headquartered in Switzerland. Today, it operates in over 180 countries and has more than 2,000 brands.
Some key facts about Nestlé:
- Annual revenue: Over $90 billion USD
- Major product categories: Beverages, confectionery, dairy, nutrition, pet care, and packaged food
- Popular brands: Nescafé, KitKat, Maggi, Nestea, Nestlé Pure Life, Purina
Nestlé’s mission is “Good Food, Good Life”, and its business strategy focuses on health, wellness, and sustainability while continuing to deliver quality products globally.
What Is the BCG Matrix?
The BCG Matrix, also called the Boston Consulting Group Matrix, is a tool that helps companies analyze their product portfolio. It classifies products into four categories based on market share and market growth.
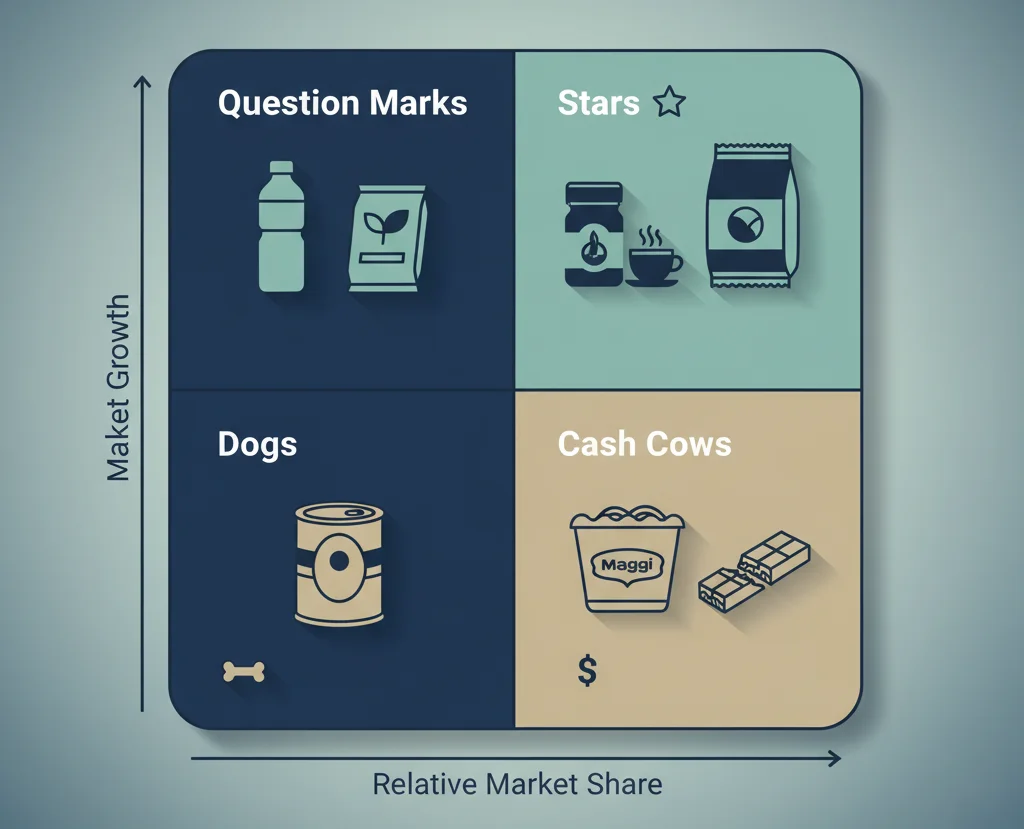
The four quadrants are:
- Stars: High growth, high market share
- Cash Cows: Low growth, high market share
- Question Marks: High growth, low market share
- Dogs: Low growth, low market share
Using this tool, companies like Nestlé can decide where to invest, maintain, or divest.
Why Use the BCG Matrix for Nestlé?
Nestlé has a huge range of products, and not all of them perform equally well in every market.
The BCG Matrix helps Nestlé to:
- Identify profitable product lines
- Decide where to allocate resources
- Guide long-term strategy
- Balance its portfolio between established products and new opportunities
BCG Matrix of Nestlé [Detailed Analysis]
1. Stars (High Growth, High Market Share)
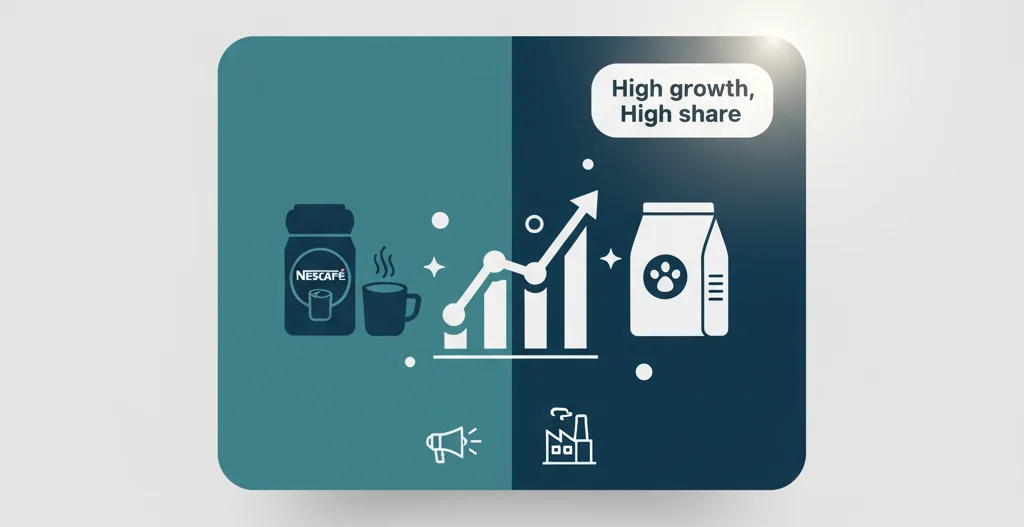
These are products that are leaders in fast-growing markets. They require large investments but also generate high revenue.
Examples for Nestlé:
- Nescafé (coffee) – Strong global demand in the coffee market
- Nestlé Pure Life (bottled water) – Popular in many countries
- Cerelac & NAN (infant nutrition) – High demand in emerging markets
- Purina (pet care) – Growing industry with strong Nestlé presence
Why they are stars: These products are in markets that are growing quickly, and Nestlé already enjoys a strong position in them.
2. Cash Cows (Low Growth, High Market Share)
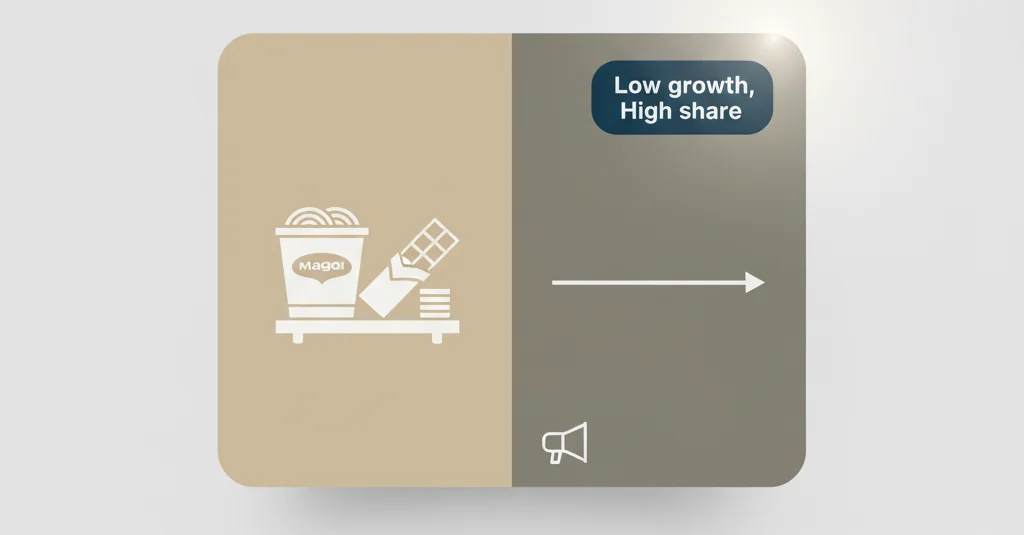
Cash cows are products that bring in steady profits. The market isn’t growing much, but these products have high brand loyalty.
Examples for Nestlé:
- Maggi (instant noodles and seasonings) – Strong brand presence, especially in Asia
- KitKat (chocolate) – Global market leader in confectionery
- Nestea – Established product in beverages
Why they are cash cows: These products don’t need much investment, but they generate consistent revenue to fund other product lines.
3. Question Marks (High Growth, Low Market Share)

These are products in fast-growing markets where Nestlé has low market share. They need heavy investment to become stars.
Examples for Nestlé:
- Plant-based foods (vegan products) – A growing trend but very competitive
- Nestlé Health Science products (nutritional supplements) – Growing demand but limited market share compared to rivals
- Sustainable packaging innovations – Still developing, requires more investment
Why they are question marks: These products have potential but aren’t strong enough in their markets yet. Nestlé must decide whether to invest more or withdraw.
4. Dogs (Low Growth, Low Market Share)
These products are in declining markets and don’t contribute much to profit.
Examples for Nestlé:
- Certain regional beverages that have lost popularity
- Some confectionery products in mature markets with declining demand
Why they are dogs: They have low growth and low market share, making them less valuable for Nestlé. The company often discontinues or repositions these products.
Related Article: BCG Matrix Of Apple Complete Analysis [Detailed]
Insights from Nestlé’s BCG Matrix
From the analysis, we can see:
- Nestlé has a good balance of stars and cash cows, which keeps the company profitable.
- Stars like Nescafé and Purina drive growth in high-potential markets.
- Cash cows like KitKat and Maggi provide stable income to support innovation.
- Question marks show where Nestlé needs to innovate and invest for future growth.
- Dogs highlight areas where the company may reduce focus or exit.
Advantages of Applying the BCG Matrix to Nestlé
- Helps Nestlé evaluate its portfolio clearly
- Assists in investment decisions
- Guides long-term planning
- Provides insights for balancing short-term and long-term growth
Limitations of the BCG Matrix in Nestlé’s Case
While the BCG Matrix is useful, it also has some limitations:
- It oversimplifies complex markets
- Ignores competition, market trends, and consumer behavior
- May not be accurate for Nestlé’s global markets, as growth rates differ by country
- Doesn’t consider synergy between products (for example, KitKat and Nescafé may complement each other in sales promotions)
Conclusion
The BCG Matrix of Nestlé shows that the company has a strong and diverse product portfolio. With stars like Nescafé and Purina driving growth, and cash cows like Maggi and KitKat ensuring stable profits, Nestlé is in a solid position.
However, the company also faces challenges with question marks and dogs. Success will depend on how well Nestlé continues to innovate, invest in health and sustainability, and adapt to changing consumer needs.
In short, the BCG Matrix helps us see why Nestlé remains a global leader in food and beverages and how it manages its wide product portfolio for long-term success.

Passionate about blogging and focused on elevating brand visibility through strategic SEO and digital marketing. Always tuned in to the latest trends, I’m dedicated to maximizing engagement and delivering measurable ROI in the dynamic world of digital marketing. Let’s connect and unlock new opportunities together!