
In today’s competitive business landscape, companies face the constant challenge of managing diverse product portfolios while making strategic decisions about where to allocate their limited resources. Should you invest more in a promising new product line? Is it time to discontinue an underperforming service? How do you balance cash generation with growth potential? These critical questions require a systematic approach to portfolio management, and that’s precisely where the BCG Matrix comes into play.
The BCG Matrix, also known as the Boston Consulting Group Growth-Share Matrix, is one of the most widely recognized and utilized strategic frameworks in business management. This powerful tool helps organizations visualize their product portfolio, assess market positioning, and make data-driven decisions about resource allocation. Whether you’re a startup managing a handful of products or a multinational corporation overseeing hundreds of business units, understanding the BCG Matrix is essential for strategic success.
In this comprehensive guide, we’ll explore everything you need to know about the BCG Matrix—from its fundamental concepts and core elements to practical applications and real-world examples. By the end of this article, you’ll have a thorough understanding of how to leverage this strategic framework to optimize your product portfolio and drive sustainable business growth.
What is the BCG Matrix?
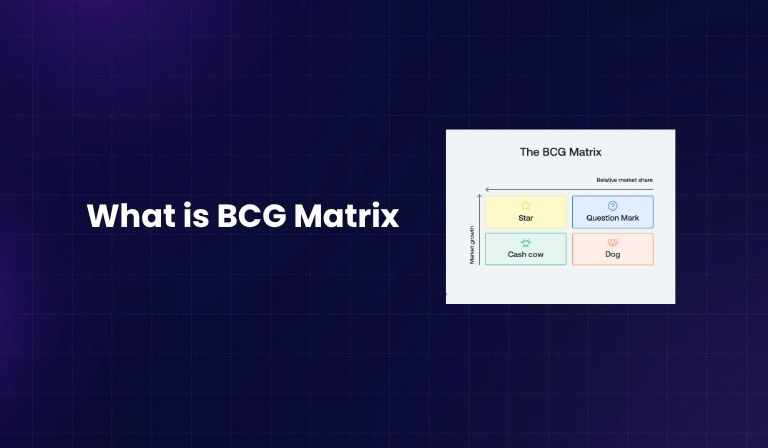
The BCG Matrix is a strategic management tool that provides a visual framework for analyzing a company’s product portfolio based on two critical dimensions: market share and market growth rate. Developed by the Boston Consulting Group, this matrix helps businesses categorize their products or business units into four distinct quadrants, each representing different strategic implications and requiring different approaches to resource allocation.
At its core, the BCG Matrix in strategic management serves as a decision-making compass that guides executives and managers in determining which products deserve increased investment, which ones should be maintained at current levels, and which ones might be candidates for divestment. The framework operates on the premise that a balanced portfolio should include a mix of products at different stages of their lifecycle—some generating cash, others consuming it for growth, and some requiring critical decisions about their future.
The beauty of the BCG Matrix lies in its simplicity and visual clarity. By plotting products on a two-dimensional grid, companies can quickly assess their entire portfolio at a glance, identify patterns, and spot opportunities or concerns that might not be apparent through traditional financial analysis alone. This bird’s-eye view of the portfolio enables more strategic conversations about resource allocation, competitive positioning, and long-term business strategy.
Understanding what is BCG Matrix also means recognizing its limitations and context. While it’s an excellent starting point for portfolio analysis, the BCG Matrix should be used in conjunction with other strategic tools and qualitative assessments. Market dynamics, competitive advantages, strategic fit, and other factors beyond just market share and growth rate should inform final decisions.
What are the Core Elements of the BCG Matrix?
To effectively use the BCG Matrix in marketing and strategic planning, you need to understand its fundamental building blocks. The framework consists of two primary axes and four strategic quadrants, each with distinct characteristics and strategic implications.
The Two Axes of the BCG Matrix
Market Share (X-Axis): The horizontal axis represents relative market share, which measures a product’s market position compared to its largest competitor. This isn’t simply about the absolute size of your market presence; it’s about your competitive standing. A high market share indicates strong competitive positioning, often correlating with economies of scale, pricing power, and profitability. Companies with dominant market share typically enjoy cost advantages that make them more profitable than smaller competitors.
Market share is typically measured on a logarithmic scale, with the dividing line between high and low usually set at 1.0 or 1.5 times the market share of the largest competitor. For example, if your product has 30% market share and the leading competitor has 20%, your relative market share would be 1.5, placing you in the “high” category.
Market Growth Rate (Y-Axis): The vertical axis represents the annual growth rate of the market in which the product competes. This metric reflects the attractiveness and dynamism of the market itself, not just your company’s performance. High-growth markets are typically more attractive because they offer opportunities for revenue expansion without necessarily taking share from competitors. They also tend to require more investment to maintain competitive positioning.
The threshold for distinguishing between high and low growth varies by industry, but a common benchmark is around 10% annual growth. Markets growing faster than this rate are considered high-growth, while those below it are viewed as mature or declining markets. The market growth rate helps predict future cash needs and opportunities.
The Four Strategic Quadrants of the BCG Matrix

The intersection of these two axes creates four quadrants, each representing a different strategic category:
Stars (High Market Share, High Growth)

Stars are the rockstars of your portfolio—products that dominate in rapidly expanding markets. These are your current success stories, representing products that have achieved significant market share in attractive, fast-growing industries. While Stars generate substantial revenue, they also require continuous investment to maintain their competitive position and support further growth.
The strategic challenge with Stars is balancing their cash generation against their investment needs. Although they’re profitable, much of that profit must be reinvested to sustain growth, fund marketing campaigns, expand production capacity, and fend off competitors. The ultimate goal is to maintain their market leadership as the market matures, eventually transitioning them into Cash Cows.
Cash Cows (High Market Share, Low Growth)

Cash Cows are the workhorses of your portfolio—mature products with dominant market positions in slow-growing or stable markets. These products have already won the competitive battle and now generate steady, predictable profits with minimal additional investment. Because the market isn’t growing rapidly, less reinvestment is needed to maintain position.
Cash Cows are critical to portfolio health because they fund the rest of the business. The cash they generate can be redirected to support Stars, invest in promising Question Marks, or fund research and development for future products. The strategic imperative for Cash Cows is operational efficiency—maximizing profitability while maintaining market position with minimal investment.
Question Marks (Low Market Share, High Growth)

Question Marks, sometimes called “Problem Children” or “Wild Cards,” represent products with small market share in high-growth markets. These products face uncertain futures—they operate in attractive markets with significant growth potential, but they haven’t yet achieved competitive dominance. Question Marks typically consume more cash than they generate because they require substantial investment to compete effectively and gain market share.
The strategic decision with Question Marks is perhaps the most difficult: should you invest aggressively to build market share and potentially transform them into Stars, or should you divest before they drain too many resources? This decision requires careful analysis of the competitive landscape, the product’s unique advantages, and the company’s capacity to fund the investment required.
Dogs (Low Market Share, Low Growth)

Dogs are products with weak market positions in unattractive, slow-growing markets. These products typically generate low profits or even losses, offering little potential for improved performance. Dogs often consume management time and resources disproportionate to their strategic value, making them prime candidates for divestment, discontinuation, or restructuring.
However, not all Dogs should be immediately eliminated. Some may serve strategic purposes beyond their direct financial contribution—they might complete a product line, support customer relationships, or generate modest positive cash flow with minimal investment. The key is ensuring that Dogs aren’t draining resources that could be better deployed elsewhere.
Who Developed the BCG Matrix?
The BCG Matrix was developed by Bruce Henderson, founder of the Boston Consulting Group, in the early 1970s. Henderson, a visionary business strategist, created the framework during a period of rapid business expansion and diversification when many companies were struggling to manage increasingly complex product portfolios.
Henderson’s insight was to recognize that different products within a company’s portfolio have fundamentally different strategic roles and financial characteristics. Before the BCG Matrix, many companies treated all products similarly in terms of resource allocation and strategic expectations. Henderson argued that this approach was fundamentally flawed—that a diversified company should be managed like an investment portfolio, with different assets serving different purposes.
The framework built on several key concepts that were revolutionary at the time:
The Experience Curve: Henderson observed that costs tend to decline predictably as cumulative production volume increases. This meant that companies with higher market share (and thus higher cumulative volume) would have inherent cost advantages over smaller competitors.
Portfolio Thinking: Rather than viewing each product or business unit in isolation, Henderson advocated for managing them as a portfolio where cash flows from some businesses could fund the growth of others.
Cash Flow Focus: The BCG Matrix shifted strategic thinking from profit to cash flow, recognizing that different businesses have different cash generation and consumption characteristics based on their market position and growth rate.
Since its introduction in the 1970s, the BCG Matrix has become one of the most taught frameworks in business schools worldwide and remains widely used by consultants, strategists, and business leaders. While it has evolved and been supplemented by other strategic tools over the decades, its fundamental logic remains relevant and powerful for portfolio management.
When to Use the BCG Matrix
The BCG Matrix isn’t appropriate for every business situation, but it excels in specific contexts where portfolio analysis and resource allocation decisions are paramount. Understanding when to deploy this framework ensures you get maximum value from the analysis.
Optimize Product Portfolio
The BCG Matrix is ideal when you need to evaluate and optimize a diverse product portfolio. If your company manages multiple products or business units across different markets, the matrix helps you see the big picture. You can identify which products are carrying their weight, which need support, and which might be holding you back.
This is particularly valuable during strategic planning cycles when leadership teams need to make tough decisions about where to focus limited resources. The visual nature of the BCG Matrix facilitates productive conversations about portfolio balance—Are you too dependent on Cash Cows? Do you have enough Stars in development? Are too many resources tied up in Dogs?
Allocate Resources Effectively
When facing resource constraints—whether financial capital, management attention, or operational capacity—the BCG Matrix provides a rational framework for prioritization. It helps answer critical questions: Which products deserve increased investment? Where should you maintain current levels? What areas might require divestment to free up resources?
The framework is especially powerful because it considers both current performance (market share) and future potential (market growth). This dual perspective prevents the common mistake of over-investing in mature products simply because they’re currently profitable, while potentially under-investing in growth opportunities.
Also Read:BCG Matrix of HUL
Identify Growth Opportunities
For companies seeking to identify and prioritize growth opportunities, the BCG Matrix highlights where the most promising prospects lie. Stars represent proven growth success stories, while Question Marks indicate potential growth opportunities that require strategic decisions.
The matrix also helps identify when it’s time to harvest mature products (Cash Cows) and redirect resources toward growth. This is particularly important for companies in danger of over-investing in declining markets or failing to adequately fund promising opportunities.
Manage an Extensive Product Portfolio
Large organizations with dozens or hundreds of products, services, or business units can easily lose sight of overall portfolio health. Individual product managers might advocate for their specific products without considering the bigger picture. The BCG Matrix provides a comprehensive view that enables senior leadership to assess performance and potential across the entire portfolio.
This macro perspective is invaluable for identifying patterns and portfolio imbalances. For example, you might discover that your portfolio is heavily weighted toward Cash Cows and Dogs, with insufficient investment in future growth (Stars and Question Marks). Or you might find too many Question Marks consuming resources without enough Cash Cows to fund them.
Enhance Strategic Planning
The BCG Matrix serves as an excellent communication tool in strategic planning sessions. Its visual simplicity makes complex portfolio dynamics accessible to board members, investors, and employees who may not have deep financial or strategic expertise. The framework creates a common language for discussing strategic priorities and trade-offs.
Furthermore, tracking how products move through the matrix over time provides insights into strategic execution and market dynamics. A Question Mark that successfully moves into the Star quadrant validates investment decisions, while a Star that remains stagnant or slips backward signals competitive challenges.
BCG Matrix Example: Samsung’s Product Portfolio
To illustrate how the BCG Matrix works in practice, let’s examine Samsung’s diverse product portfolio—one of the world’s most extensive electronics and technology portfolios. This BCG Matrix with example demonstrates how a global corporation applies strategic portfolio management principles.
Cash Cows: Established Television Sets
Samsung’s television business represents a classic Cash Cow. The company has maintained a dominant market share in the global TV market for over 15 years, consistently ranking as the world’s leading TV manufacturer by units sold and revenue. However, the television market itself is mature, with modest single-digit annual growth rates in most developed markets.
Samsung’s TV division generates substantial and predictable profits with relatively modest incremental investment. The technology is well-established, manufacturing processes are highly efficient, and the brand commands premium pricing. These characteristics allow Samsung to extract significant cash from this business unit, which the company then redirects to fund research and development in emerging technologies, support growth in mobile devices, and invest in semiconductor manufacturing.
The strategic approach to this Cash Cow is optimization and efficiency. Samsung focuses on maintaining its market leadership through incremental innovation (larger screens, better resolution, smart features) while carefully managing costs. The profits from television sales effectively subsidize Samsung’s investments in higher-growth, higher-risk product categories.
Stars: Foldable Phone Segment
Samsung’s foldable smartphone line—including the Galaxy Z Fold and Galaxy Z Flip series—exemplifies a Star product. This category represents one of the fastest-growing segments in the smartphone market, with annual growth rates exceeding 50% in recent years. Samsung has established itself as the clear market leader in this space, holding approximately 75% of the global foldable phone market.
However, maintaining this Star status requires continuous substantial investment. Samsung must invest heavily in R&D to improve folding technology, reduce costs, enhance durability, and introduce new features. Marketing expenses are significant as the company works to educate consumers about the benefits of foldable devices and justify premium pricing. Manufacturing investments are necessary to scale production and improve yields.
The strategic imperative for this Star is to maintain market leadership while the category expands and matures. Samsung is competing to establish its foldable phones as the standard before competitors can catch up. The company accepts that this product line consumes significant resources in the short term, betting that as the market matures, foldable phones will transition from Stars to Cash Cows, generating substantial returns on today’s investments.
Question Marks: Virtual Reality Headsets
Samsung’s position in virtual reality represents a classic Question Mark situation. The VR market is experiencing rapid growth, driven by advances in technology, declining prices, and increasing applications beyond gaming (including training, education, and enterprise uses). Market analysts project double-digit annual growth for the VR industry over the next several years.
However, Samsung’s market share in this space is relatively modest, particularly compared to competitors like Meta (Oculus), Sony, and HTC. Samsung has experimented with VR through products like the Gear VR (in partnership with Oculus) and has the technological capability to compete, but hasn’t committed to the aggressive investment that would be necessary to become a market leader.
This Question Mark presents Samsung with a strategic decision: Should the company invest heavily to build significant market share in a promising growth market? Or should it maintain a limited presence, redirect those resources to more promising opportunities, or exit the market entirely? The decision requires careful consideration of the competitive dynamics, Samsung’s unique advantages, and the company’s broader strategic priorities.
Dogs: Older Phone Models
Legacy smartphone models from previous generations represent Dogs in Samsung’s portfolio. These older devices—perhaps models from two or three years ago—have low market share in a declining segment (as customers upgrade to newer models) and generate minimal profit margins. They occupy retail shelf space, require customer support resources, and consume management attention despite their limited strategic value.
The smartphone market itself is maturing, with slower growth rates in developed markets and increasing commoditization in entry-level segments. Older models face intense price competition and generate little brand value or technological differentiation.
Samsung’s strategy for these Dogs is typically to discontinue them systematically, clearing inventory through discounts and focusing resources on current and future generations. Some older models may be maintained selectively in specific markets where they still have demand, but the general approach is to minimize resources devoted to these products and redirect attention to more promising opportunities.
How to Use the BCG Matrix: A Step-by-Step Guide
Implementing the BCG Matrix effectively requires a systematic approach to data collection, analysis, and strategic planning. Here’s a comprehensive guide to applying this framework to your business.
Step 1: Gather Relevant Data
The foundation of any BCG Matrix analysis is accurate, relevant data. You’ll need to collect information for each product, service, or business unit you want to include in your analysis:
Market Share Data: Calculate the relative market share for each product. This requires knowing both your product’s market share and the market share of your largest competitor. The formula is:
Relative Market Share = Your Product’s Market Share / Largest Competitor’s Market Share
For example, if your product has 25% market share and the leading competitor has 20%, your relative market share is 1.25. If your product has 15% market share and the leader has 30%, your relative market share is 0.5.
Market Growth Rate Data: Determine the annual growth rate of the market (not just your company’s growth rate) for each product category. This typically requires market research data, industry reports, or analysis of overall market trends. Focus on a relevant time period—usually the most recent year or an average of the past 2-3 years.
Revenue and Profitability Data: While not directly plotted on the matrix, understanding each product’s revenue contribution and profitability provides essential context for strategic decisions. A high-share product that’s barely profitable might warrant different treatment than one generating strong margins.
Investment and Cash Flow Data: Document current investment levels and cash flow characteristics for each product. Understanding which products are net cash generators versus cash consumers helps validate the matrix placement and informs resource allocation decisions.
Step 2: Plot Products on the Matrix
Once you have the data, create your BCG Matrix by plotting each product based on its market share (x-axis) and market growth rate (y-axis). Each product is typically represented by a circle, with the size of the circle proportional to the product’s revenue contribution to the overall business.
Divide the matrix into quadrants:
Cash Cows (Lower Right): High market share (typically >1.0 relative share), low growth (typically <10% annual market growth)
Stars (Upper Right): High market share (>1.0 relative share), high growth (>10% annual market growth)
Question Marks (Upper Left): Low market share (<1.0 relative share), high growth (>10% annual market growth)
Dogs (Lower Left): Low market share (<1.0 relative share), low growth (<10% annual market growth)
Note that the specific thresholds for “high” versus “low” should be calibrated to your industry context. Some industries might use 5% as the growth threshold, while others might use 15% or more.
Step 3: Analyze Each Quadrant
With your products plotted on the matrix, analyze each quadrant to understand your portfolio composition:
Evaluate Portfolio Balance: A healthy portfolio typically includes Cash Cows generating resources, Stars consuming resources for growth, a limited number of carefully selected Question Marks being developed, and minimal Dogs. An imbalanced portfolio might have too many Dogs draining resources, insufficient Cash Cows to fund growth, or too many Question Marks without clear paths to market leadership.
Assess Individual Products: Look at each product within its quadrant. Are there Stars at risk of slipping into Question Mark territory? Are Cash Cows showing signs of market share erosion? Are any Question Marks showing strong momentum toward Star status?
Identify Strategic Gaps: Are you over-invested in mature markets (too many Cash Cows and Dogs) with insufficient focus on growth? Or are you spread too thin across multiple Question Marks without enough stable cash generation?
Step 4: Formulate Strategic Recommendations
Based on your analysis, develop strategic recommendations for each quadrant:
Cash Cows Strategy:
- Maximize cash generation through operational efficiency
- Maintain market position with minimal investment
- Use profits to fund Stars and selected Question Marks
- Avoid over-investing in enhancements that don’t protect market position
- Harvest steadily while the market remains stable
Stars Strategy:
- Invest aggressively to maintain or grow market share
- Accept that these products will consume significant resources
- Prioritize competitive advantages that protect market position
- Prepare for the transition to Cash Cow status as markets mature
- Focus on sustainable competitive advantages
Question Marks Strategy:
- Conduct rigorous analysis to determine investment potential
- For promising Question Marks: Invest decisively to build market share
- For uncertain Question Marks: Establish clear milestones and timelines
- For unpromising Question Marks: Divest before significant resources are consumed
- Avoid the trap of maintaining multiple underfunded Question Marks
Dogs Strategy:
- Evaluate whether products serve strategic purposes beyond direct financial returns
- For most Dogs: Plan orderly divestment or discontinuation
- Minimize resource allocation and management attention
- Harvest remaining value where possible
- Consider niche repositioning only if compelling strategic logic exists
Step 5: Create Action Plans
Translate strategic recommendations into concrete action plans with specific initiatives, timelines, responsibilities, and success metrics. For example:
- For a Cash Cow: “Reduce manufacturing costs by 15% over 18 months through automation and process optimization. Maintain market share within 2 percentage points of current levels while reducing marketing spend by 20%.”
- For a Star: “Increase production capacity by 40% to support projected demand growth. Launch three new feature enhancements in the next 12 months. Increase marketing budget by 30% to defend against new competitor entry.”
- For a Question Mark: “Conduct comprehensive competitive analysis within 60 days. Based on findings, either commit additional $5M investment to capture market share or initiate divestment process within 90 days.”
- For a Dog: “Discontinue product line by end of fiscal year. Complete inventory sell-off within 6 months. Redeploy 80% of associated resources to Star products.”
What Are the Benefits of Using the BCG Matrix?
The BCG Matrix has endured for over five decades because it delivers tangible strategic value. Understanding these benefits helps you leverage the framework more effectively.
Strategic Product Management
The BCG Matrix provides clarity in strategic product management by defining distinct categories and appropriate strategies for each. Rather than treating all products the same, you can tailor your approach based on each product’s strategic role. This prevents the common mistake of under-investing in growth opportunities while over-investing in declining products.
The framework also facilitates more productive strategic discussions. Instead of emotional debates about favorite products, teams can have objective conversations grounded in market data and strategic logic. The categories provide a shared vocabulary that aligns leadership, management, and operational teams around portfolio priorities.
Clear Visual Analysis
One of the BCG Matrix’s greatest strengths is its visual simplicity. Complex portfolio dynamics become immediately apparent when products are plotted on the matrix. You can quickly identify which products are performing well, which are struggling, and where your portfolio might be out of balance.
This visual clarity is particularly valuable when communicating with stakeholders who may not have detailed knowledge of every product line. Board members, investors, and employees can grasp portfolio strategy at a glance. The matrix also facilitates comparison between different time periods, allowing you to track strategic progress visually.
Market Position Insights
The BCG Matrix clarifies your competitive positioning in each market where you compete. By explicitly considering relative market share, the framework forces honest assessment of competitive strength. This prevents self-delusion about market position—either over-confidence based on absolute size or under-estimation based on perceived weaknesses.
Understanding market position relative to competitors enables more realistic strategic planning. A Question Mark product that’s significantly behind the market leader requires different strategies than one that’s close to parity. A Cash Cow with eroding market share signals competitive threats that demand attention despite strong current profitability.
Focused Growth Strategies
The BCG Matrix helps companies focus growth strategies on products and markets with the highest potential. By distinguishing between high-growth and low-growth markets, the framework prevents the common mistake of trying to grow revenue in mature markets where growth is expensive and difficult.
The matrix also highlights the importance of achieving strong market positions in growth markets—identifying Stars as the ideal strategic outcome. This focus helps companies avoid the trap of participating in many high-growth markets without achieving leadership in any of them, which typically leads to poor financial performance.
Resource Allocation Discipline
Perhaps most importantly, the BCG Matrix imposes discipline on resource allocation decisions. It makes explicit the strategic logic of moving cash from Cash Cows to Stars and selected Question Marks, rather than spreading resources evenly or investing based on political considerations.
This discipline is particularly valuable in preventing what would otherwise be natural tendencies: over-investing in mature businesses where executives have the most experience, under-investing in growth due to near-term profit pressures, or maintaining dying products due to emotional attachment or organizational inertia.
Portfolio Risk Management
The BCG Matrix helps identify portfolio risks that might not be apparent from financial statements alone. A portfolio heavily weighted toward Cash Cows might look financially strong in the short term but faces existential risk if those markets decline. Conversely, a portfolio with mostly Question Marks might show exciting growth potential but lacks the stable cash generation needed to fund that growth.
By visualizing portfolio composition, the framework enables proactive risk management through deliberate portfolio construction rather than reactive crisis management.
FAQs
What is BCG Matrix in simple terms?
The BCG Matrix is a strategic tool that helps businesses analyze their product portfolio based on market share and market growth, guiding decisions on where to invest or divest.
Why is the BCG Matrix important in strategic management?
It helps allocate resources effectively, balance risk, and ensure sustained profitability by identifying products that drive growth and those that drain resources.
What are the four categories of the BCG Matrix?
Stars, Cash Cows, Question Marks, and Dogs—each representing different combinations of market share and market growth.
What is an example of the BCG Matrix?
Samsung’s foldable smartphones (Stars), televisions (Cash Cows), VR headsets (Question Marks), and old phone models (Dogs).
How does the BCG Matrix help in marketing?
It helps marketers determine which products need more advertising, which ones to phase out, and how to allocate budgets for maximum impact.
What are the limitations of the BCG Matrix?
It doesn’t account for market dynamics, competitor moves, or synergies between products. It’s best used alongside other analytical tools.
Conclusion
The BCG Matrix remains one of the most powerful tools in strategic management and marketing.
By categorizing products into Stars, Cash Cows, Question Marks, and Dogs, organizations gain clarity on how to allocate resources efficiently and ensure long-term sustainability.
In an era where markets evolve rapidly, the BCG Matrix offers timeless wisdom — helping businesses maintain balance between profitability, innovation, and growth.
A digital marketer with a strong focus on SEO, content creation, and AI tools. Creates helpful, easy-to-understand content that connects with readers and ranks well on search engines. Loves using smart tools to save time, improve content quality, and grow online reach.