

Summary
This article provides a comprehensive and detailed explanation of the BCG Matrix of Google, one of the most influential technology
companies in the world. Using the Google BCG Matrix, we’ll explore how the company categorizes its wide range of products—like Search, YouTube, Android, Maps, and Google Cloud—into four distinct quadrants: Stars, Cash Cows, Question Marks, and Dogs.
The BCG Matrix is a powerful business tool that helps companies like Google make strategic decisions on where to invest, which products to grow, and which to discontinue.
We’ll also compare this with other real-world examples of BCG Matrix, such as the Starbucks BCG Matrix, and discuss the major uses of BCG Matrix in business strategy and portfolio management.
Google is not just a search engine—it’s an ecosystem that connects billions of people daily through its products, services, and platforms. From Gmail and YouTube to Android and Google Cloud, nearly everyone interacts with a Google product every day.
Founded in 1998 by Larry Page and Sergey Brin, Google’s mission has always been “to organize the world’s information and make it universally accessible and useful.” Over the years, this mission has guided the company to create some of the most innovative products in the tech industry.
But have you ever wondered how Google decides which products to invest in, which ones to continue improving, and which ones to discontinue?
That’s where the BCG Matrix of Google comes in—a strategic framework that helps the company evaluate its massive product portfolio based on market growth and market share.
Before we dive into Google’s analysis, let’s understand what the BCG Matrix is and why it’s one of the most widely used tools in business strategy.
What is BCG Matrix?
The BCG Matrix, or Boston Consulting Group Matrix, is a strategic management tool that helps businesses analyze their product portfolio and prioritize investments. It was developed in the 1970s by the Boston Consulting Group to help companies decide which products or business units to grow, maintain, harvest, or divest.
The model evaluates a company’s offerings based on two key dimensions:
- Market Growth Rate – How fast the market is expanding.
- Relative Market Share – How dominant a product is compared to competitors.
These two dimensions form a 2×2 matrix, dividing products into four categories:
- Stars: High market growth, high market share
- Cash Cows: Low market growth, high market share
- Question Marks: High market growth, low market share
- Dogs: Low market growth, low market share
Each quadrant represents a strategic approach for resource allocation and future business planning. For instance, a company might invest more in Star products to maintain leadership or phase out Dog products that bring minimal returns.
To make it clearer, the Google BCG Matrix serves the same purpose as the Starbucks BCG Matrix or any other corporate analysis—it helps the brand identify which areas are profitable, sustainable, and worth scaling.
The Axes of the BCG Matrix
Understanding the axes is key to interpreting any example of BCG Matrix, including Google’s.
- The X-Axis represents Relative Market Share, indicating the competitive strength of a product. It’s calculated as:
Relative Market Share=Brand’s Market ShareLargest Competitor’s Market Share\text{Relative Market Share} = \frac{\text{Brand’s Market Share}}{\text{Largest Competitor’s Market Share}}Relative Market Share=Largest Competitor’s Market ShareBrand’s Market Share
A value above 1 means the product leads the market, while a value below 1 suggests a weaker position. - The Y-Axis represents Market Growth Rate, which measures the overall potential of a market or product category. Fast-growing markets typically require more investment but also offer higher returns.
These axes are logarithmic, meaning they reflect exponential differences rather than linear ones—so a small change in market share can represent a huge competitive advantage.
The Four Quadrants of the BCG Matrix
The BCG Matrix divides products into four categories:
- Stars:
Products with high market growth and high market share. They are leaders in fast-growing industries. Example: YouTube and Google Maps. - Cash Cows:
Products with high market share but low market growth. They generate steady revenue and profits. Example: Google Search and Ads. - Question Marks (Problem Children):
Products with low market share but high growth potential. They require investment to become Stars. Example: Google Cloud and Google Drive. - Dogs:
Products with low growth and low market share. They often yield little profit and are considered for divestment. Example: Google Plus and Google Glass.
Google’s Product Portfolio Overview

Google has over 250+ products and services, ranging from software to hardware, spanning almost every digital sector imaginable. Here’s a simplified breakdown:
1. Web-Based Products
Includes Google Search, Gmail, Google Ads, Google Analytics, and YouTube—all serving billions of users daily.
2. Developer Tools
Platforms like Google Cloud, Google Developers, and Android Studio empower millions of developers worldwide.
3. Operating Systems
Google owns Android OS (for smartphones) and Chrome OS (for desktops), which together power a majority of global devices.
4. Mobile and Desktop Applications
From Google Maps, Google Photos, and Google Drive to Chrome Browser—these apps are part of daily digital life.
5. Hardware and Services
Google Pixel phones, Nest smart devices, and Chromecast have helped Google enter the consumer electronics space.
With such a vast ecosystem, the BCG Matrix of Google helps prioritize which products to nurture and which to phase out.
The BCG Matrix of Google (Overview)
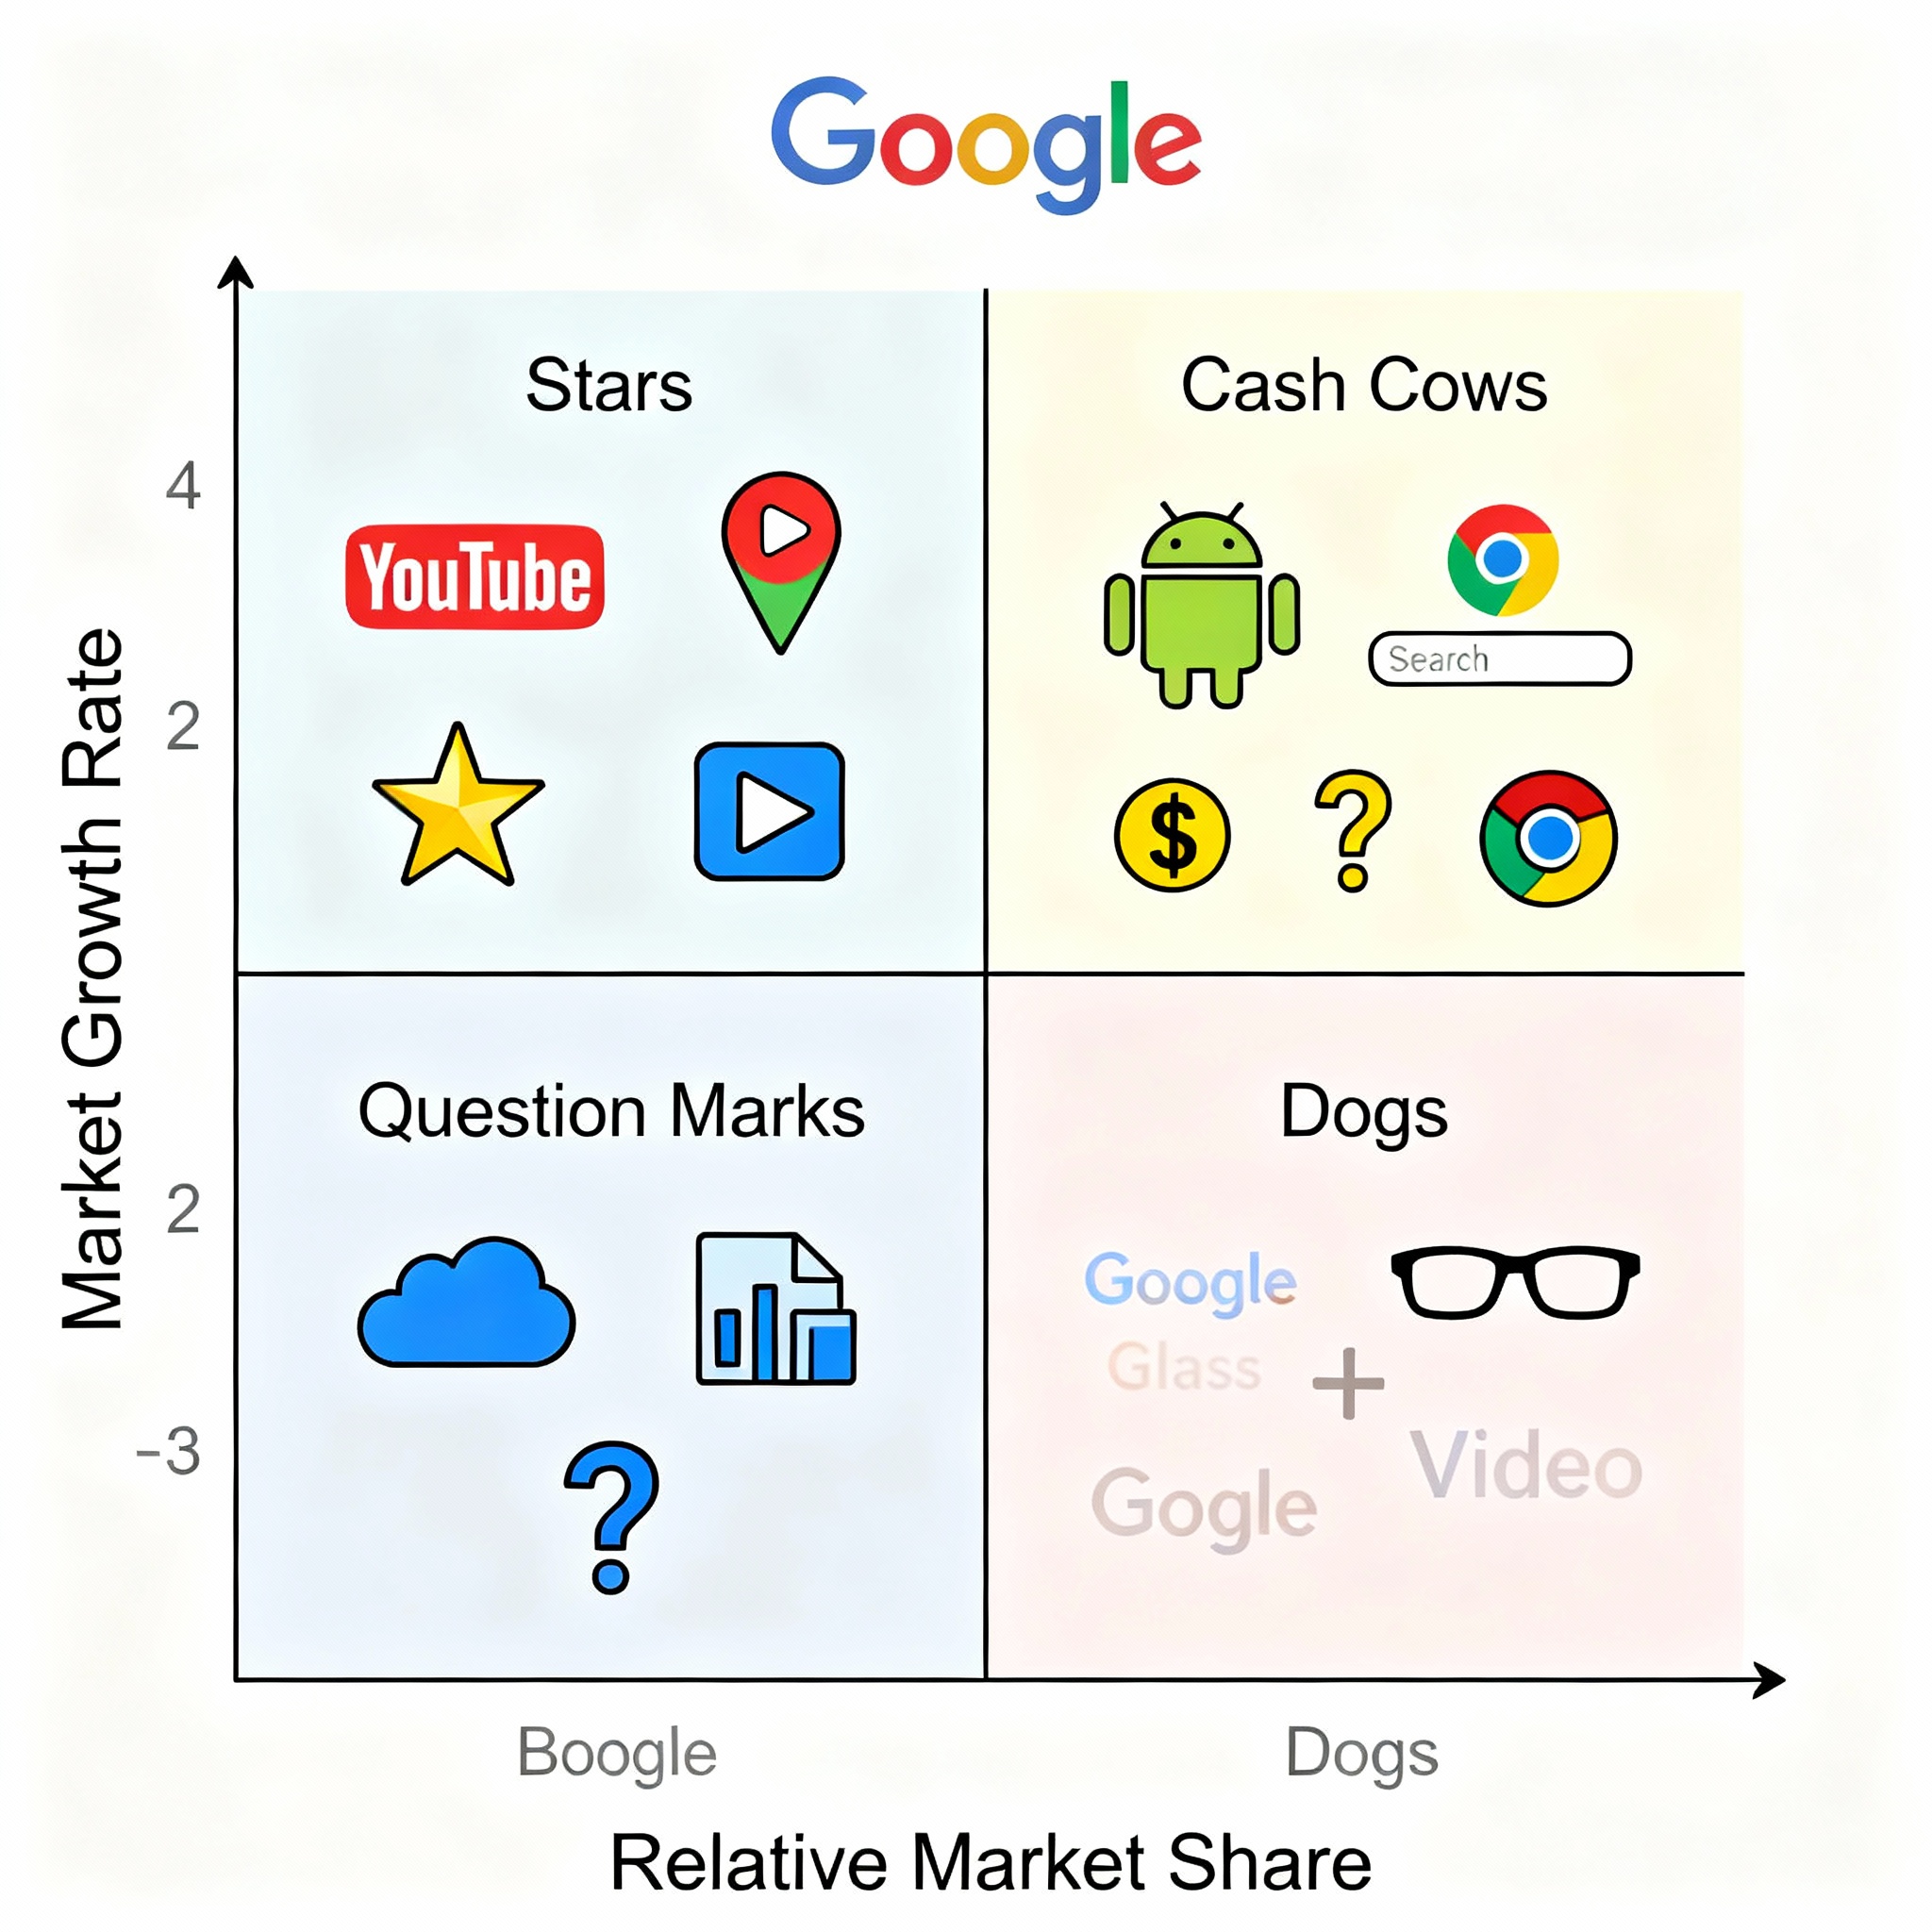
Below is a summary of how Google’s key products fall into each quadrant:
| Quadrant | Product Category | Examples |
| Stars | High growth, high market share | YouTube, Google Maps, Google Assistant |
| Cash Cows | Low growth, high market share | Google Search, Android OS, Chrome Browser |
| Question Marks | High growth, low market share | Google Cloud, Google Drive, Google Pay |
| Dogs | Low growth, low market share | Google Glass, Google+, Google Video |
Now, let’s dive deeper into each of these quadrants and analyze what makes them significant.
Cash Cows of Google

Cash Cows are products that generate stable, consistent cash flow. They require little investment and have already achieved market dominance.
Key Cash Cow Products:
- Google Search & Advertising
Google’s advertising division is the backbone of its revenue, accounting for nearly 70% of total earnings. Almost every user interaction—from YouTube videos to Gmail ads—is powered by this ecosystem.
Its dominance in the search engine market (over 90% global share) makes it a textbook example of BCG Matrix Cash Cow. - Android OS and Chrome Browser
Android is the world’s most used mobile OS, while Chrome dominates desktop browsing with nearly 45% share.
Despite slower market growth, these platforms continue to generate steady profits through ad integration and app ecosystems.
Why They Matter:
Google uses profits from Cash Cows to fund high-growth divisions like AI, Cloud, and new ventures.
Star Products of Google
Stars represent Google’s innovation-driven growth engines. These products dominate fast-growing markets but require significant investment to maintain leadership.
Also Read: BCG Matrix of ITC
Key Star Products:
- YouTube
A global leader in video streaming with over 2 billion monthly users. YouTube Ads generated over $15 billion in revenue in a single year. The platform’s growing user base and engagement make it Google’s most valuable Star. - Google Maps
Used by over 1 billion people monthly, Google Maps dominates navigation and location-based services. Its integration with businesses, food delivery, and transportation services expands its ecosystem continuously. - Google Assistant & Smart Ecosystem
With the rise of AI and smart devices, Google Assistant has become central to the company’s future. It drives Google’s smart home products like Nest and Pixel devices.
Why They Matter:
Star products symbolize growth and brand innovation. Like in the Starbucks BCG Matrix, where premium drinks act as Stars, Google’s Star products fuel its long-term expansion.
Question Mark Products of Google
Question Marks, or “Problem Children,” have strong market growth potential but currently lack large market share. They’re at a crossroads—Google must decide whether to invest or withdraw.
Key Question Mark Products:
- Google Drive & Google Docs
Popular among individuals and businesses, but faces intense competition from Microsoft Office 365 and Dropbox. Growth is strong, but profitability is lower. - Google Cloud Platform (GCP)
One of Google’s biggest investments. Competes with Amazon AWS and Microsoft Azure. Although its market share is smaller, the cloud industry’s growth potential keeps Google investing heavily. - Google Pay
A growing player in fintech and digital payments. However, its competition from PayPal, PhonePe, and Apple Pay limits its dominance.
Why They Matter:
Question Marks define Google’s future opportunities. Proper investment can turn them into Stars, but poor performance might relegate them to Dogs.
Dog Products of Google

Dogs are low-growth, low-share products that no longer align with the company’s goals. Google is known for discontinuing such products quickly.
Key Dog Products:
- Google Video Player
Introduced before YouTube’s acquisition, it was soon discontinued as YouTube became dominant. - Google Glass
A visionary but premature innovation in augmented reality. It failed commercially due to privacy concerns and limited usability. - Google Plus (Google+)
Launched as a competitor to Facebook but never achieved significant engagement. It was shut down in 2019.
Why They Matter:
Dog products reflect Google’s experimental nature—failure is part of innovation. Google’s agility in shutting down underperforming products ensures efficient resource utilization.
Uses of BCG Matrix in Google’s Strategy
The uses of BCG Matrix go far beyond categorization—it directly influences Google’s long-term business strategy.
- Resource Allocation – Helps decide where to invest more (Stars), maintain (Cash Cows), or cut losses (Dogs).
- Product Development – Encourages innovation in fast-growing markets like AI and Cloud.
- Strategic Focus – Guides diversification and expansion decisions.
- Performance Evaluation – Provides a visual framework for comparing product performance.
- Risk Management – Balances high-risk ventures with stable revenue streams.
By consistently analyzing its portfolio through the Google BCG Matrix, the company maintains a strong balance between innovation and profitability.
Key Takeaways
- The BCG Matrix of Google provides insights into how the tech giant manages over 250 diverse products.
- Stars like YouTube and Maps fuel future growth.
- Cash Cows like Search and Android sustain financial stability.
- Question Marks such as Cloud and Pay represent future opportunities.
- Dogs show Google’s willingness to innovate, fail, and evolve.
- Like the Starbucks BCG Matrix, Google’s model shows how big corporations use this tool for continuous product portfolio optimization.
Conclusion
The BCG Matrix of Google demonstrates how one of the world’s most innovative companies manages complexity with clarity. By identifying which products are Stars, Cash Cows, Question Marks, and Dogs, Google efficiently allocates resources and stays ahead of competitors.
This example of BCG Matrix shows that even tech giants must make hard choices—invest in the future, maintain the present, and retire the past.
For any business—whether a startup or a global brand—the uses of BCG Matrix lie in its simplicity and strategic power. It’s a timeless tool that turns data into direction, helping companies grow smartly, just like Google.
FAQs
What is the purpose of the BCG Matrix of Google?
The Google BCG Matrix helps the company evaluate which products are profitable, which need investment, and which should be discontinued to ensure sustainable growth.
What are Google’s Cash Cow products?
Google Search, Android OS, and Chrome Browser are Cash Cows—these products generate consistent revenue with minimal investment.
Which products are Stars in the Google BCG Matrix?
YouTube, Google Maps, and Google Assistant are Star products with high market growth and share.
What are some uses of BCG Matrix for businesses?
The uses of BCG Matrix include resource allocation, market strategy development, risk management, and portfolio analysis.
How does the Starbucks BCG Matrix relate to Google’s?
Both Starbucks and Google use the BCG Matrix to analyze diverse products—Stars represent growth drivers, Cash Cows sustain profits, and Dogs indicate declining segments.
A digital marketer with a strong focus on SEO, content creation, and AI tools. Creates helpful, easy-to-understand content that connects with readers and ranks well on search engines. Loves using smart tools to save time, improve content quality, and grow online reach.