

Summary
The Boston Consulting Group (BCG) Matrix is one of the most powerful strategic tools in business management, designed to help organizations analyze their product portfolios and make informed investment decisions. Introduced by the Boston Consulting Group in the early 1970s, the model helps companies identify which products, business units, or services deserve greater attention, which should be maintained, and which may need to be discontinued.
In this in-depth and descriptive blog, we explore the BCG Matrix in detail—its components, purpose, advantages, limitations, and practical applications in real-world industries. The analysis includes a thorough explanation of each quadrant—Stars, Cash Cows, Question Marks, and Dogs—and how organizations can use this framework to maximize profitability, optimize resources, and ensure sustainable growth.
By the end of this article, you’ll have a clear understanding of how the Boston Consulting Group (BCG) Matrix can guide strategic decision-making in today’s competitive and evolving global business environment.
In an era of constant market change, every business faces the same fundamental question—where should we invest our resources to achieve the highest returns? The Boston Consulting Group (BCG) Matrix provides a scientific and visual approach to answering this question.
Developed by Bruce D. Henderson in 1970 for the Boston Consulting Group, the BCG Matrix is also known as the Growth-Share Matrix. It evaluates a company’s products or business units based on two crucial dimensions: market growth rate and relative market share.
Market growth indicates how attractive a market is and how fast it is expanding, while relative market share reflects the company’s strength or dominance within that market compared to competitors. By plotting business units within a four-quadrant matrix, organizations can identify which areas require investment, which should be nurtured, and which are consuming resources without generating significant returns.
The BCG Matrix remains one of the most widely used tools for portfolio management and long-term strategic planning across industries—from consumer goods and technology to banking, healthcare, and manufacturing.
What is the BCG Matrix

The Boston Consulting Group (BCG) Matrix divides a company’s portfolio into four distinct categories based on the interplay between market growth and market share. These categories are Stars, Cash Cows, Question Marks, and Dogs.
Each category has its own strategic implications and requires different management decisions. Let’s examine the two key dimensions that shape this matrix:
Market Growth Rate
This represents the potential and attractiveness of the market. A high growth rate indicates emerging opportunities, while a low growth rate suggests maturity or decline.
Relative Market Share
This shows the company’s competitive strength in that market. A high market share typically means dominance and cost advantages, while a low market share implies weaker competitive positioning.
The interaction of these two dimensions helps companies visualize where each of their products, services, or divisions stands in terms of performance and growth potential.
The Four Quadrants of the BCG Matrix
Stars – High Market Share, High Market Growth
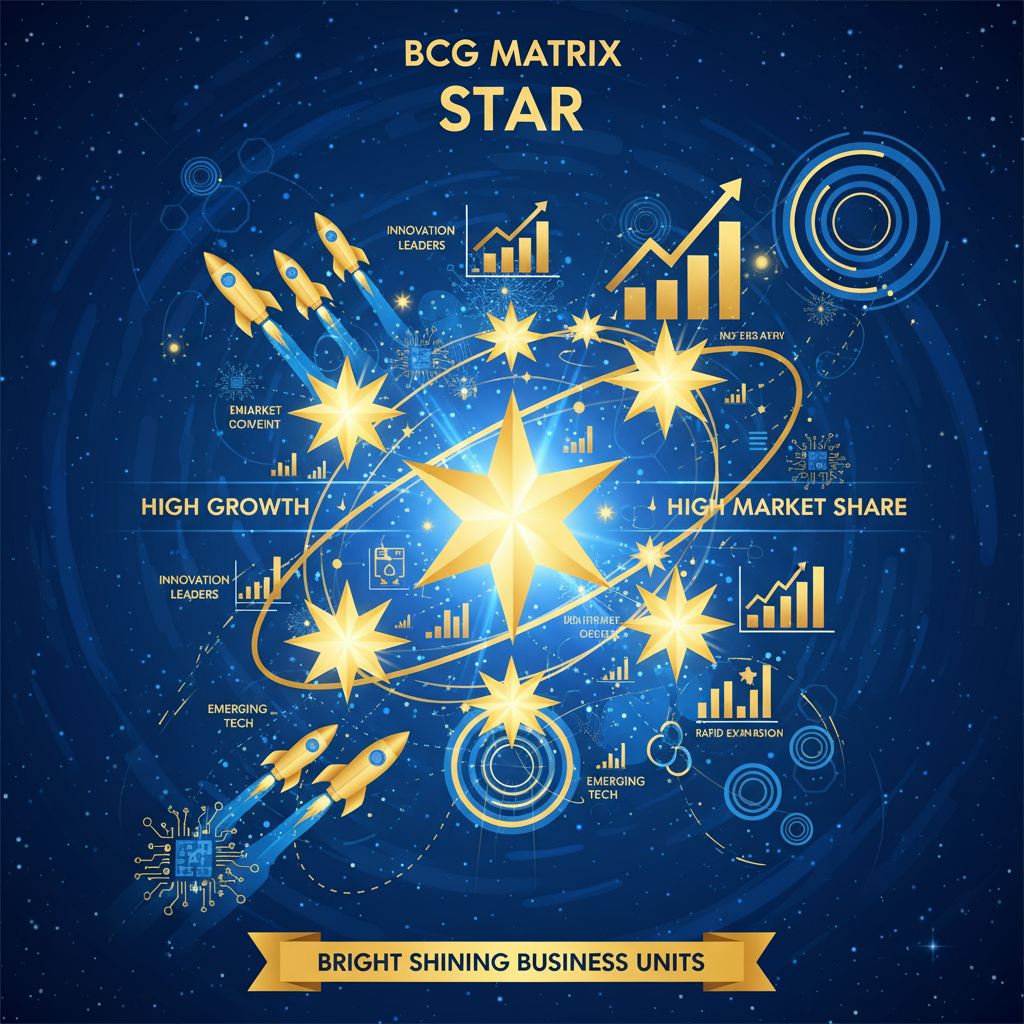
The Stars are the most promising business units or products in a company’s portfolio. They dominate fast-growing markets and generate significant revenue, but they also require continuous investment to maintain their leadership position.
Characteristics of Stars:
- Operate in fast-expanding markets
- Require heavy investment to sustain growth and market share
- Have high profitability potential
- Often represent the company’s future growth drivers
Strategic Focus for Stars:
Organizations should continue to invest in Star products to capitalize on market momentum. Over time, as the market matures, Stars often evolve into Cash Cows, becoming stable profit generators.
Examples of Stars:
- Apple’s iPhone during its early years of explosive growth
- Electric vehicles for automotive companies like Tesla
- Cloud computing services for firms like Amazon Web Services and Microsoft Azure
Stars represent innovation, leadership, and strategic priority within an organization.
Cash Cows – High Market Share, Low Market Growth
Cash Cows are the backbone of profitability for most organizations. These are established, mature products or business units that enjoy a strong market share in slow-growing markets.
Characteristics of Cash Cows:
- Operate in stable, mature markets
- Generate consistent cash flow with minimal investment
- Have loyal customer bases
- Fund other business divisions, including Stars and Question Marks
Strategic Focus for Cash Cows:
Companies should maximize efficiency and profitability from these units. Excess cash generated from Cash Cows can be reinvested into Stars and Question Marks to ensure future growth.
Examples of Cash Cows:
- Microsoft Office suite, which generates steady revenue with minimal innovation costs
- Coca-Cola’s core beverage line, which dominates a mature global market
- Consumer banking services in established markets
Cash Cows ensure financial stability and enable organizations to fund innovation and expansion in other areas.
Question Marks – Low Market Share, High Market Growth

Question Marks, also known as Problem Children, are business units or products operating in attractive, fast-growing markets but with low market share. They hold great potential but require strategic decision-making—either to invest heavily and turn them into Stars or to divest if they don’t show promising results.
Characteristics of Question Marks:
- Operate in fast-expanding markets with high uncertainty
- Require substantial investment to grow market share
- May become future Stars or fail to gain traction
- Represent the riskiest but most opportunity-rich part of the portfolio
Strategic Focus for Question Marks:
Organizations need to analyze whether the business can become competitive. If so, they should invest aggressively in marketing, technology, and distribution. If not, they should consider divesting to avoid financial strain.
Examples of Question Marks:
- Electric scooters or alternative mobility services for traditional automakers
- New AI-based startups competing against larger tech firms
- Emerging e-commerce brands trying to gain recognition
Question Marks require visionary leadership and bold decision-making to either scale up successfully or exit strategically.
Dogs – Low Market Share, Low Market Growth
Dogs are business units or products that operate in declining or stagnant markets with minimal market share. They generate low profits or even losses, often consuming resources that could be better used elsewhere.
Characteristics of Dogs:
- Operate in saturated or shrinking markets
- Offer minimal returns
- Have declining demand or outdated technology
- Often face intense competition without differentiation
Strategic Focus for Dogs:
The ideal approach is to minimize investment, restructure operations, or exit the market entirely. However, in some cases, niche positioning or product innovation can help transform certain Dogs into profitable entities.
Examples of Dogs:
- Traditional print media businesses struggling in the digital era
- Outdated mobile phone models replaced by newer technologies
- Legacy hardware companies facing software-driven disruption
Dogs highlight areas where strategic downsizing or resource reallocation can benefit overall business performance.
Also Read: BCG Matrix of Ford Motor
Importance of the BCG Matrix in Strategic Management
The Boston Consulting Group (BCG) Matrix remains one of the most widely used tools in corporate strategy because of its simplicity and effectiveness. It helps companies visualize the balance of their portfolio and make informed decisions regarding investment priorities.
Key Benefits of the BCG Matrix:
Strategic Clarity
It helps businesses clearly identify where each division or product stands in terms of performance and growth potential.
Efficient Resource Allocation
The model guides leaders in allocating capital, manpower, and innovation efforts toward the most promising areas.
Long-term Planning
By identifying Stars and Question Marks, organizations can plan for future revenue streams while maintaining short-term profitability through Cash Cows.
Risk Diversification
The BCG Matrix helps companies balance their portfolio between high-growth, high-risk areas and stable, low-growth segments.
Decision-making Support
It serves as a foundation for critical strategic choices like market expansion, product development, or divestment.
Through these benefits, the BCG Matrix plays a vital role in strategic planning, ensuring that organizations remain both profitable and forward-looking.
Real-World Applications of the BCG Matrix
The BCG Matrix is not limited to any particular industry. Its universal applicability makes it valuable for multinational corporations, startups, and even public sector organizations.
In the Technology Industry
Tech companies like Google, Apple, and Microsoft use the matrix to balance innovation and maturity. For example, Google Search acts as a Cash Cow, while emerging ventures like AI and Cloud are Stars or Question Marks.
In the FMCG Industry
FMCG giants such as Unilever, Nestlé, and Procter & Gamble use the model to decide which product lines to prioritize. Established brands like Dove and Nescafé act as Cash Cows, while new sustainable or health-focused products fall into the Star or Question Mark categories.
In Banking and Financial Services
Banks apply the BCG Matrix to evaluate different services—credit cards, loans, investment products, and digital banking platforms—based on profitability and growth potential.
In the Automobile Industry
Automotive companies like Toyota or Ford use it to assess segments such as electric vehicles (Stars), traditional petrol cars (Cash Cows), and hybrid technologies (Question Marks).
The BCG Matrix helps organizations across sectors make data-driven decisions that align with market dynamics and business goals.
Limitations of the BCG Matrix
While the Boston Consulting Group (BCG) Matrix is a valuable analytical tool, it has certain limitations that managers must consider.
Simplistic Approach
The model assumes that market share and growth are the only determinants of profitability, ignoring other factors such as brand strength, innovation, and customer loyalty.
Static Representation
It provides a snapshot of performance at a specific time but does not account for dynamic market changes or future disruptions.
Difficult Measurement
Accurate calculation of market growth and share can be complex, especially in diverse or emerging industries.
Neglect of Interdependencies
It overlooks how different business units may support each other within a company’s ecosystem, such as shared technology or brand equity.
Despite these challenges, the BCG Matrix remains a valuable starting point for portfolio evaluation and long-term strategy formulation.
How to Use the BCG Matrix Effectively
To maximize the effectiveness of the BCG Matrix, organizations should follow a structured approach:
- Gather accurate market and financial data for each business unit.
- Plot each unit on the matrix based on market growth and share.
- Analyze performance trends and competitive forces.
- Prioritize investments for Stars and select Question Marks with high potential.
- Optimize operations for Cash Cows to sustain profitability.
- Reassess or divest underperforming Dog segments.
Regular reviews are essential since market conditions evolve rapidly, especially in technology-driven sectors.
Conclusion
The Boston Consulting Group (BCG) Matrix (2025 Analysis) remains one of the most practical and insightful frameworks for evaluating business portfolios. It enables organizations to balance short-term profitability with long-term growth through a structured understanding of market performance and competitive positioning.
Stars like emerging technologies and innovation-driven sectors drive growth. Cash Cows like mature product lines ensure financial stability. Question Marks represent the opportunities of tomorrow, while Dogs signal where transformation or exit strategies are needed.
By applying the BCG Matrix intelligently, businesses can align their investments with strategic priorities, reduce risk, and maintain long-term competitiveness in a volatile global market.
The key to success lies not just in plotting data on the matrix but in interpreting it correctly and acting decisively based on market insights.
FAQs
What is the Boston Consulting Group (BCG) Matrix?
The BCG Matrix is a strategic tool that categorizes a company’s business units or products based on market growth and market share to aid in resource allocation and investment decisions.
What are the four quadrants of the BCG Matrix?
The four quadrants are Stars, Cash Cows, Question Marks, and Dogs—each representing different stages of growth and profitability.
Why is the BCG Matrix important in business strategy?
It helps organizations identify high-performing and underperforming areas, optimize investments, and plan long-term growth strategies.
What are examples of Cash Cows and Stars in real companies?
For example, Apple’s iPhone is a Star, while Microsoft Office is a Cash Cow that generates consistent profits in a mature market.
Is the BCG Matrix still relevant in 2025?
Yes. Despite evolving markets and digital transformation, the BCG Matrix remains relevant for analyzing portfolio performance and making informed strategic decisions.
A digital marketer with a strong focus on SEO, content creation, and AI tools. Creates helpful, easy-to-understand content that connects with readers and ranks well on search engines. Loves using smart tools to save time, improve content quality, and grow online reach.