

Summary
The BCG Matrix of Toyota provides a comprehensive strategic perspective on how one of the world’s largest automobile manufacturers manages its diverse business portfolio. Toyota Motor Corporation operates across multiple vehicle segments, including sedans, SUVs, trucks, hybrids, and electric vehicles. The Toyota BCG analysis reveals how the company strategically allocates resources among its various divisions—some being highly profitable and mature while others represent future opportunities or declining categories.
In this in-depth analysis, we will explore Toyota’s position in each quadrant of the Boston Consulting Group (BCG) Matrix—Stars, Cash Cows, Question Marks, and Dogs—and examine how the company balances innovation, profitability, and sustainability in the rapidly evolving automotive industry.
This descriptive and informative blog explains each aspect of Toyota’s business using the BCG Matrix framework, supported by real-world examples, financial insights, and strategic interpretation for 2025.
Toyota Motor Corporation, founded in 1937 by Kiichiro Toyoda, is a global leader in automotive manufacturing and innovation. Headquartered in Toyota City, Japan, it operates in more than 170 countries and employs over 370,000 people worldwide. For decades, Toyota has been synonymous with reliability, quality, and technological advancement.
As of 2025, Toyota continues to lead the global automobile market with its vast range of vehicles, from fuel-efficient sedans to advanced hybrid and electric cars. However, with rapid changes in consumer preferences, government regulations, and environmental sustainability concerns, Toyota faces new challenges and opportunities.
The BCG Matrix of Toyota helps us analyze how its product portfolio performs in different markets and which categories are driving growth, generating profits, or declining. By placing each business division or vehicle segment into one of the four quadrants of the BCG Matrix, we can understand Toyota’s long-term strategic direction.
About Toyota Motor Corporation
![]()
Toyota is one of the most valuable automotive brands in the world and has consistently ranked among the top car manufacturers by global sales. It operates across multiple sectors including passenger vehicles, hybrid technology, luxury automobiles, and electric mobility.
Its key brands and subsidiaries include:
- Toyota – the core brand offering sedans, hatchbacks, and SUVs
- Lexus – the luxury vehicle division
- Daihatsu – known for small and compact cars
- Hino Motors – specializing in commercial vehicles and trucks
- Toyota Financial Services – providing financing, insurance, and leasing solutions
Toyota’s portfolio reflects a well-diversified business model that balances stability with innovation, allowing it to adapt to shifting market dynamics while maintaining its global leadership.
What is the BCG Matrix
The Boston Consulting Group (BCG) Matrix is a strategic framework that helps organizations evaluate their business units or products based on two key parameters:
- Market Growth Rate: Represents the attractiveness or potential of the market in which a product operates.
- Relative Market Share: Indicates the strength or dominance of a product or business compared to competitors.
The matrix classifies businesses into four categories:
Stars: High market share and high market growth. These are the key growth drivers that require substantial investment but offer promising returns.
Cash Cows: High market share but low market growth. These are mature, stable segments that generate consistent profits with limited need for further investment.
Question Marks: Low market share but high market growth. These segments have potential but need strategic decisions and investment to become future stars.
Dogs: Low market share and low market growth. These divisions may require restructuring, repositioning, or divestment.
The BCG Matrix of Toyota helps analyze how the company’s various business segments perform in terms of profitability, growth, and market competitiveness.
Also Read: BCG Matrix of Axis Bank
Why the BCG Matrix is Important for Toyota
Toyota’s operations span multiple markets and product categories, each with unique challenges and growth potential. Using the BCG Matrix, Toyota can:
- Identify which product lines are most profitable.
- Allocate resources efficiently across divisions.
- Evaluate the success of new technologies such as hybrid and electric vehicles.
- Recognize underperforming segments and decide whether to retain or exit them.
- Achieve long-term balance between innovation-driven and profit-driven divisions.
The matrix acts as a guide for Toyota’s management to ensure that innovation aligns with profitability while maintaining global competitiveness.
BCG Matrix Analysis of Toyota
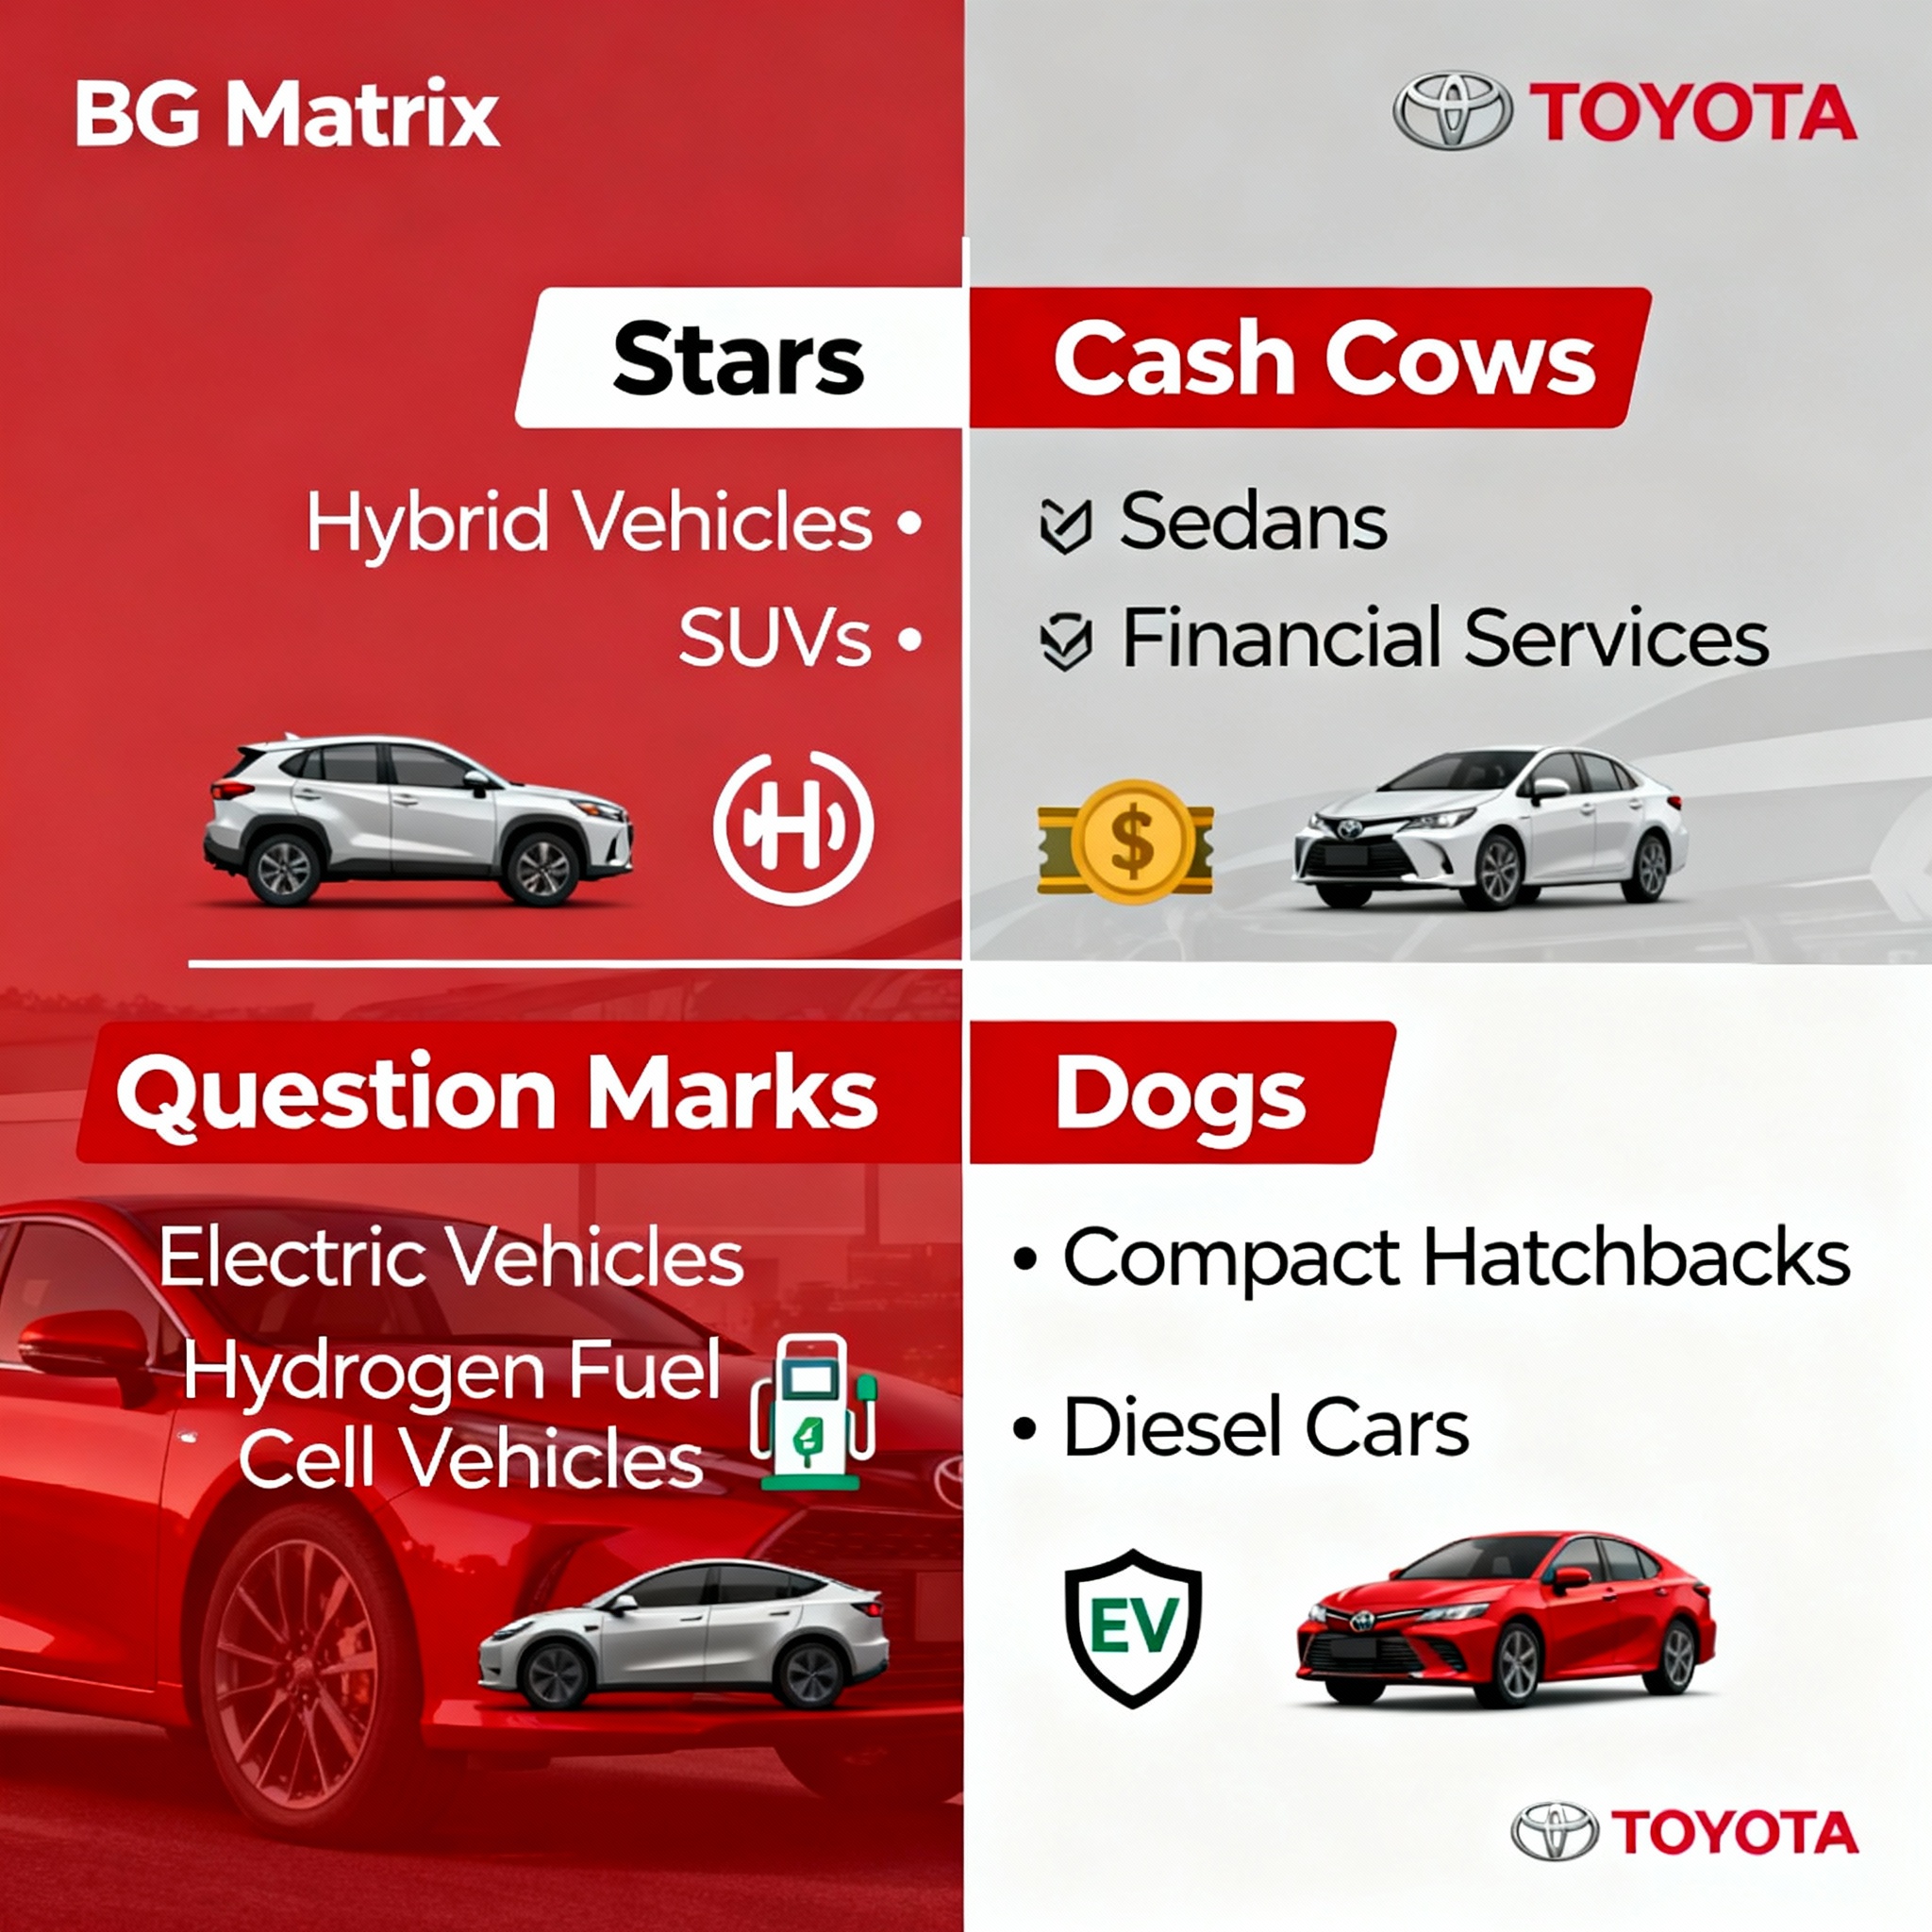
The Toyota BCG analysis divides the company’s business portfolio into four distinct categories: Stars, Cash Cows, Question Marks, and Dogs. Each category represents the market position and growth dynamics of Toyota’s various products and divisions.
Stars – High Market Share and High Market Growth
The Star category includes Toyota’s fastest-growing and most promising businesses. These segments demand heavy investment but are vital for future leadership.
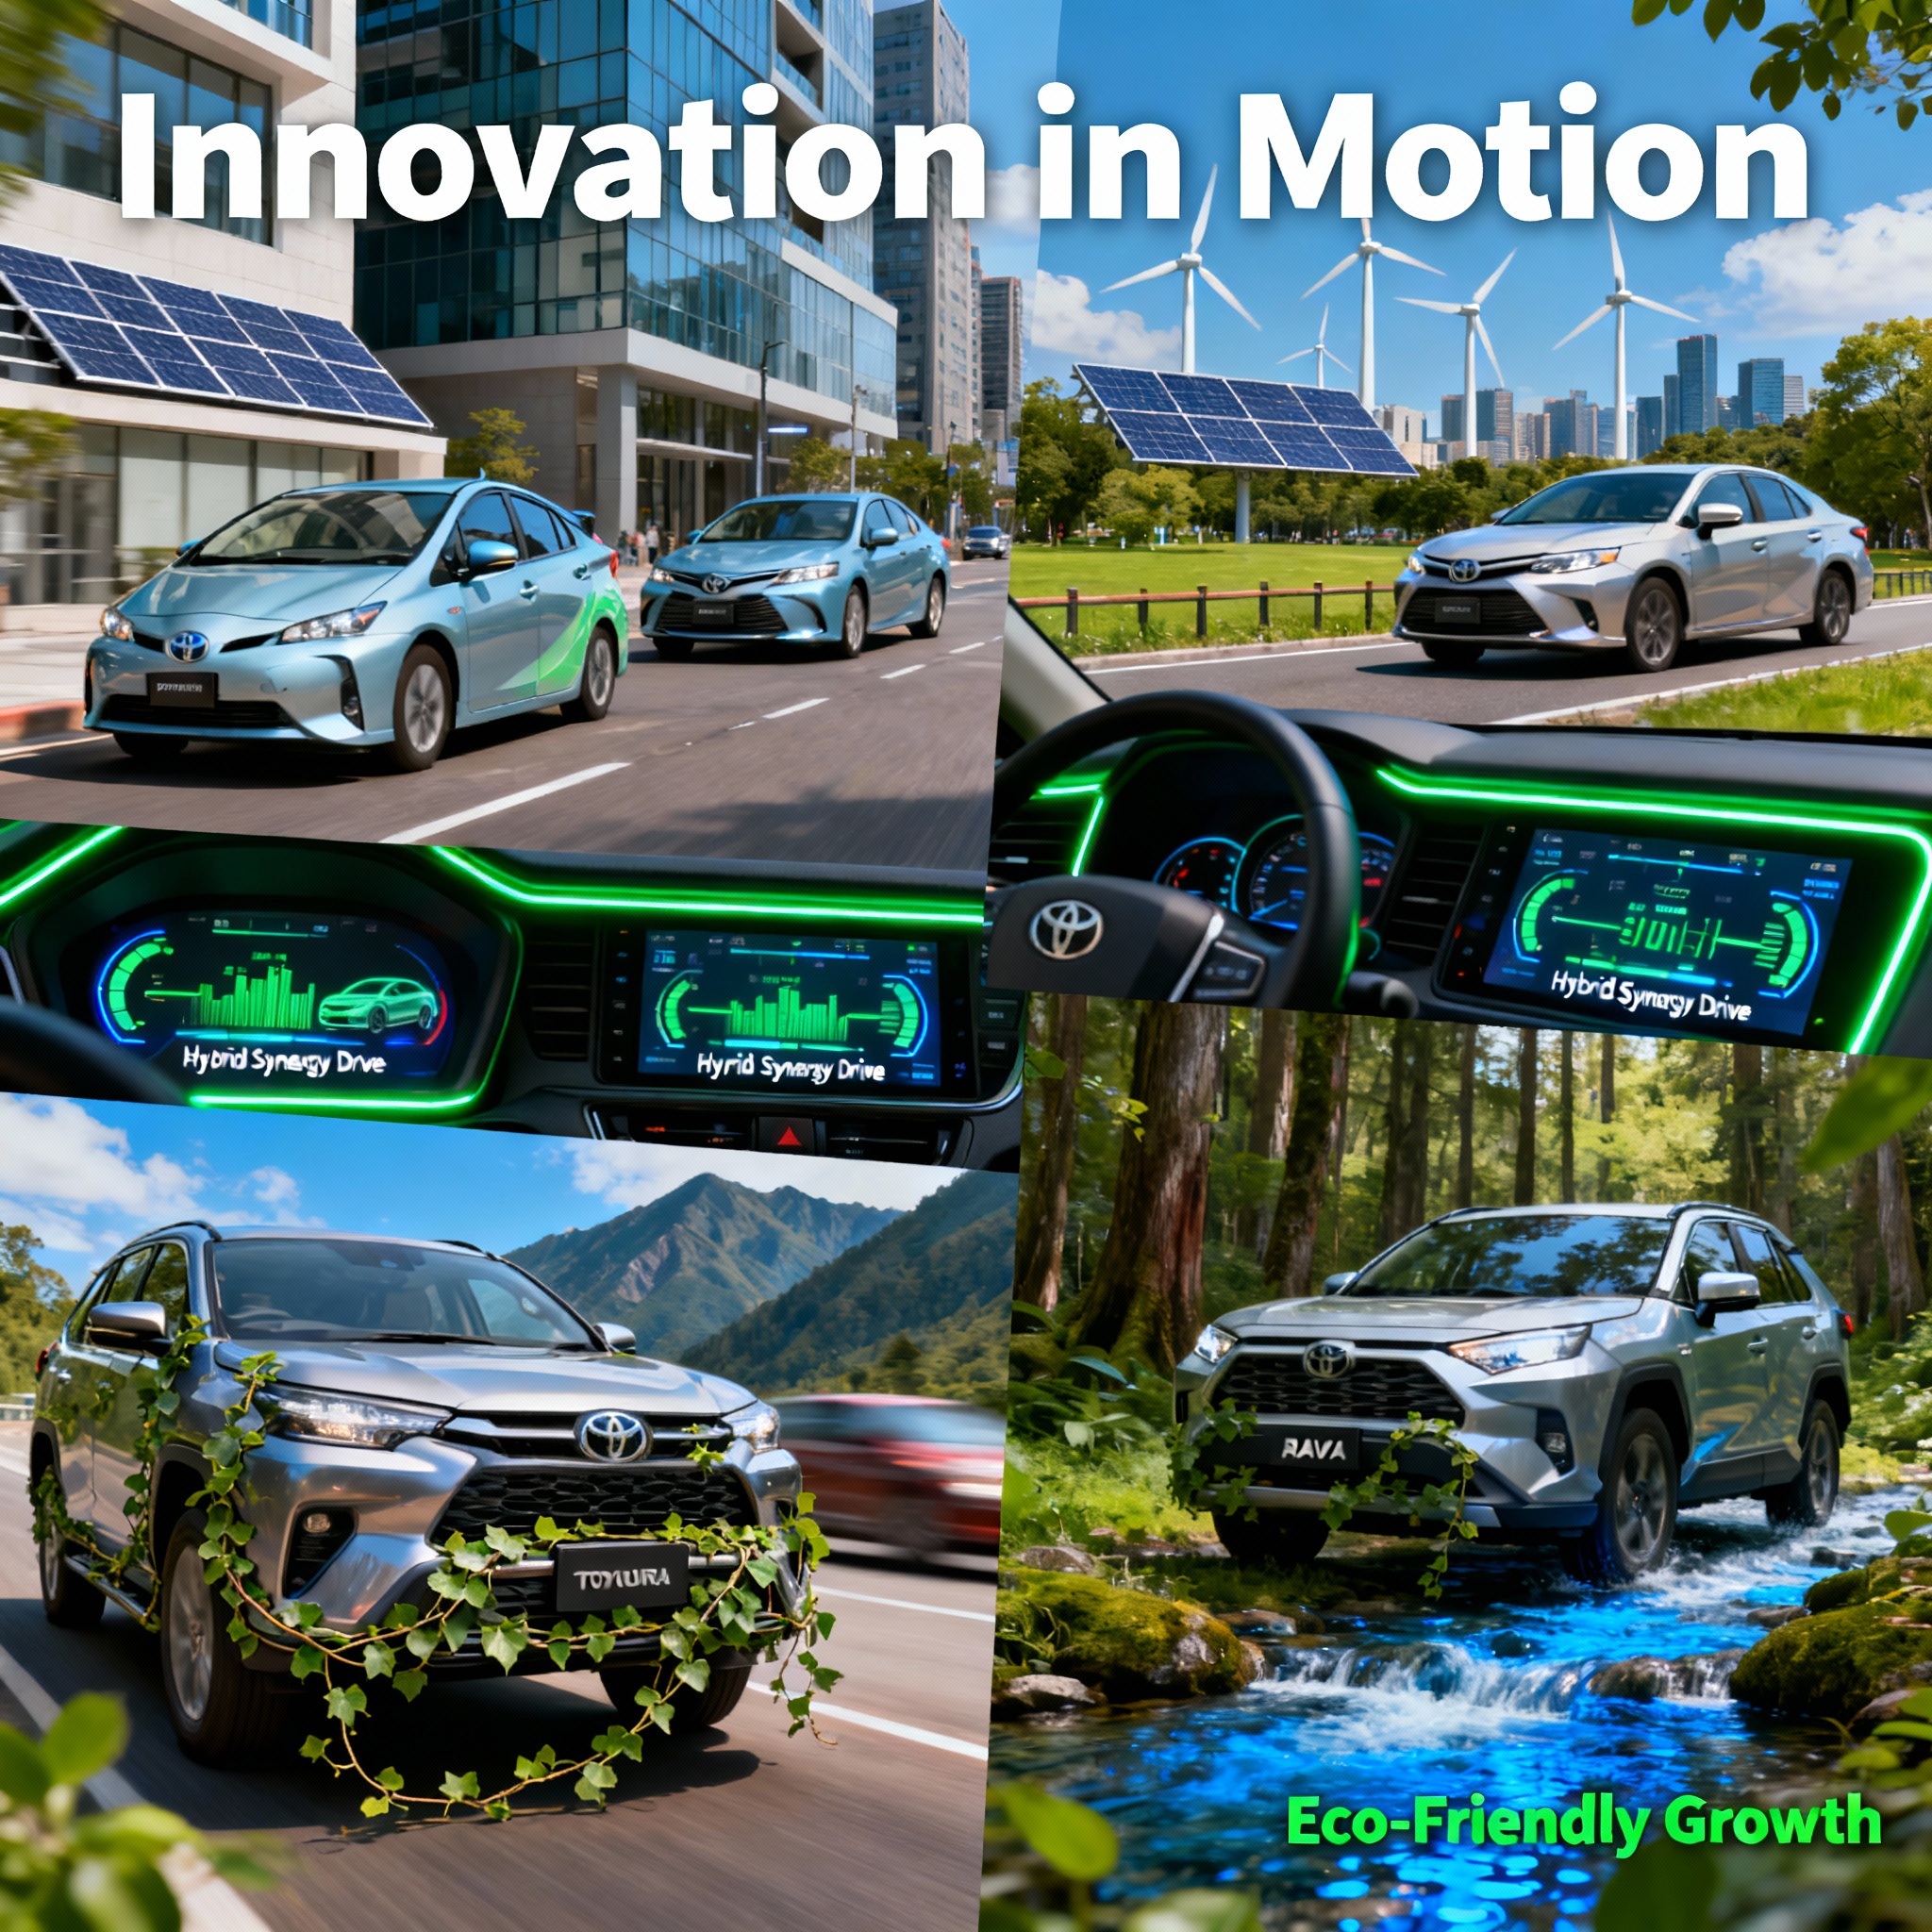
Hybrid Vehicles
Toyota pioneered hybrid technology with the launch of the Toyota Prius in 1997, making it the first mass-produced hybrid car in the world. Today, Toyota continues to dominate the hybrid vehicle segment globally.
Hybrid vehicles combine a traditional internal combustion engine with an electric motor, improving fuel efficiency and reducing emissions.
The company’s hybrid portfolio includes the Corolla Hybrid, Camry Hybrid, and RAV4 Hybrid—all of which have witnessed increasing demand in markets such as the United States, Japan, and Europe.
Toyota’s investment in hybrid technology has positioned it as the undisputed leader in this high-growth category.
With global environmental awareness increasing, governments promoting green mobility, and fuel prices fluctuating, Toyota’s hybrid division remains one of its strongest growth engines.
SUVs and Crossovers
SUVs have become a global phenomenon, and Toyota has successfully captured a major share of this segment through models such as the Toyota Fortuner, RAV4, and Highlander.
These vehicles combine durability, luxury, and performance, making them popular across both developed and emerging markets.
The SUV market continues to grow rapidly, driven by consumer preferences for comfort, safety, and road presence. Toyota’s brand trust and diverse SUV lineup have solidified its position in this segment.
Both hybrid vehicles and SUVs are considered Stars because they combine strong market share with expanding demand, driving Toyota’s overall growth strategy.
Cash Cows – High Market Share and Low Market Growth

Cash Cows represent Toyota’s mature and stable segments that continue to generate high profits despite limited market growth.
Sedan Division
Toyota’s sedans, particularly models like the Toyota Corolla, Camry, and Yaris, have been global best-sellers for decades. The Corolla alone has sold over 50 million units worldwide, making it the best-selling car in history.
While the sedan market has reached maturity and is growing slowly, it still contributes significantly to Toyota’s revenue. The Corolla remains a top choice among consumers seeking reliability, fuel efficiency, and affordability.
Because of its massive sales volume and brand equity, the sedan segment provides steady cash flow for Toyota to invest in future technologies like electric and hydrogen vehicles.
Toyota Financial Services
This division provides car loans, insurance, and leasing solutions to millions of Toyota customers worldwide.
The financial services business generates predictable, recurring income with minimal capital investment.
Though it doesn’t grow as fast as other divisions, it remains critical for Toyota’s overall profitability and customer retention.
These two divisions are Toyota’s financial backbone—low in market growth but high in profitability and stability—thus categorized as Cash Cows.
Question Marks – Low Market Share and High Market Growth

Question Marks represent emerging segments that hold potential but currently have a small market share.
Electric Vehicles (EVs)
While Toyota was a pioneer in hybrid technology, it entered the fully electric vehicle market later than some competitors such as Tesla and BYD.
However, Toyota is now investing heavily in its Beyond Zero (bZ) series to capture this growing market.
EVs represent one of the fastest-growing sectors globally, driven by environmental policies, government incentives, and the transition to zero-emission mobility.
Toyota plans to launch 10 new EV models by 2026 and aims for EVs to contribute a significant portion of its sales by 2030.
Despite the late entry, Toyota’s brand strength, R&D capabilities, and hybrid expertise could help it become a future leader in the EV market.
Hydrogen Fuel Cell Vehicles (FCVs)
Toyota is also focusing on hydrogen-powered cars like the Toyota Mirai.
Fuel cell vehicles are environmentally friendly and emit only water vapor.
However, due to high costs, limited refueling infrastructure, and lack of widespread adoption, FCVs currently occupy a niche segment.
With increased global investment in hydrogen technology, this division could evolve into a Star in the coming years.
Both EVs and FCVs are currently Question Marks—they have strong growth potential but relatively low market share and require significant investment.
Dogs – Low Market Share and Low Market Growth
Dog categories include business units or vehicle models that contribute little to profits and show limited growth potential.
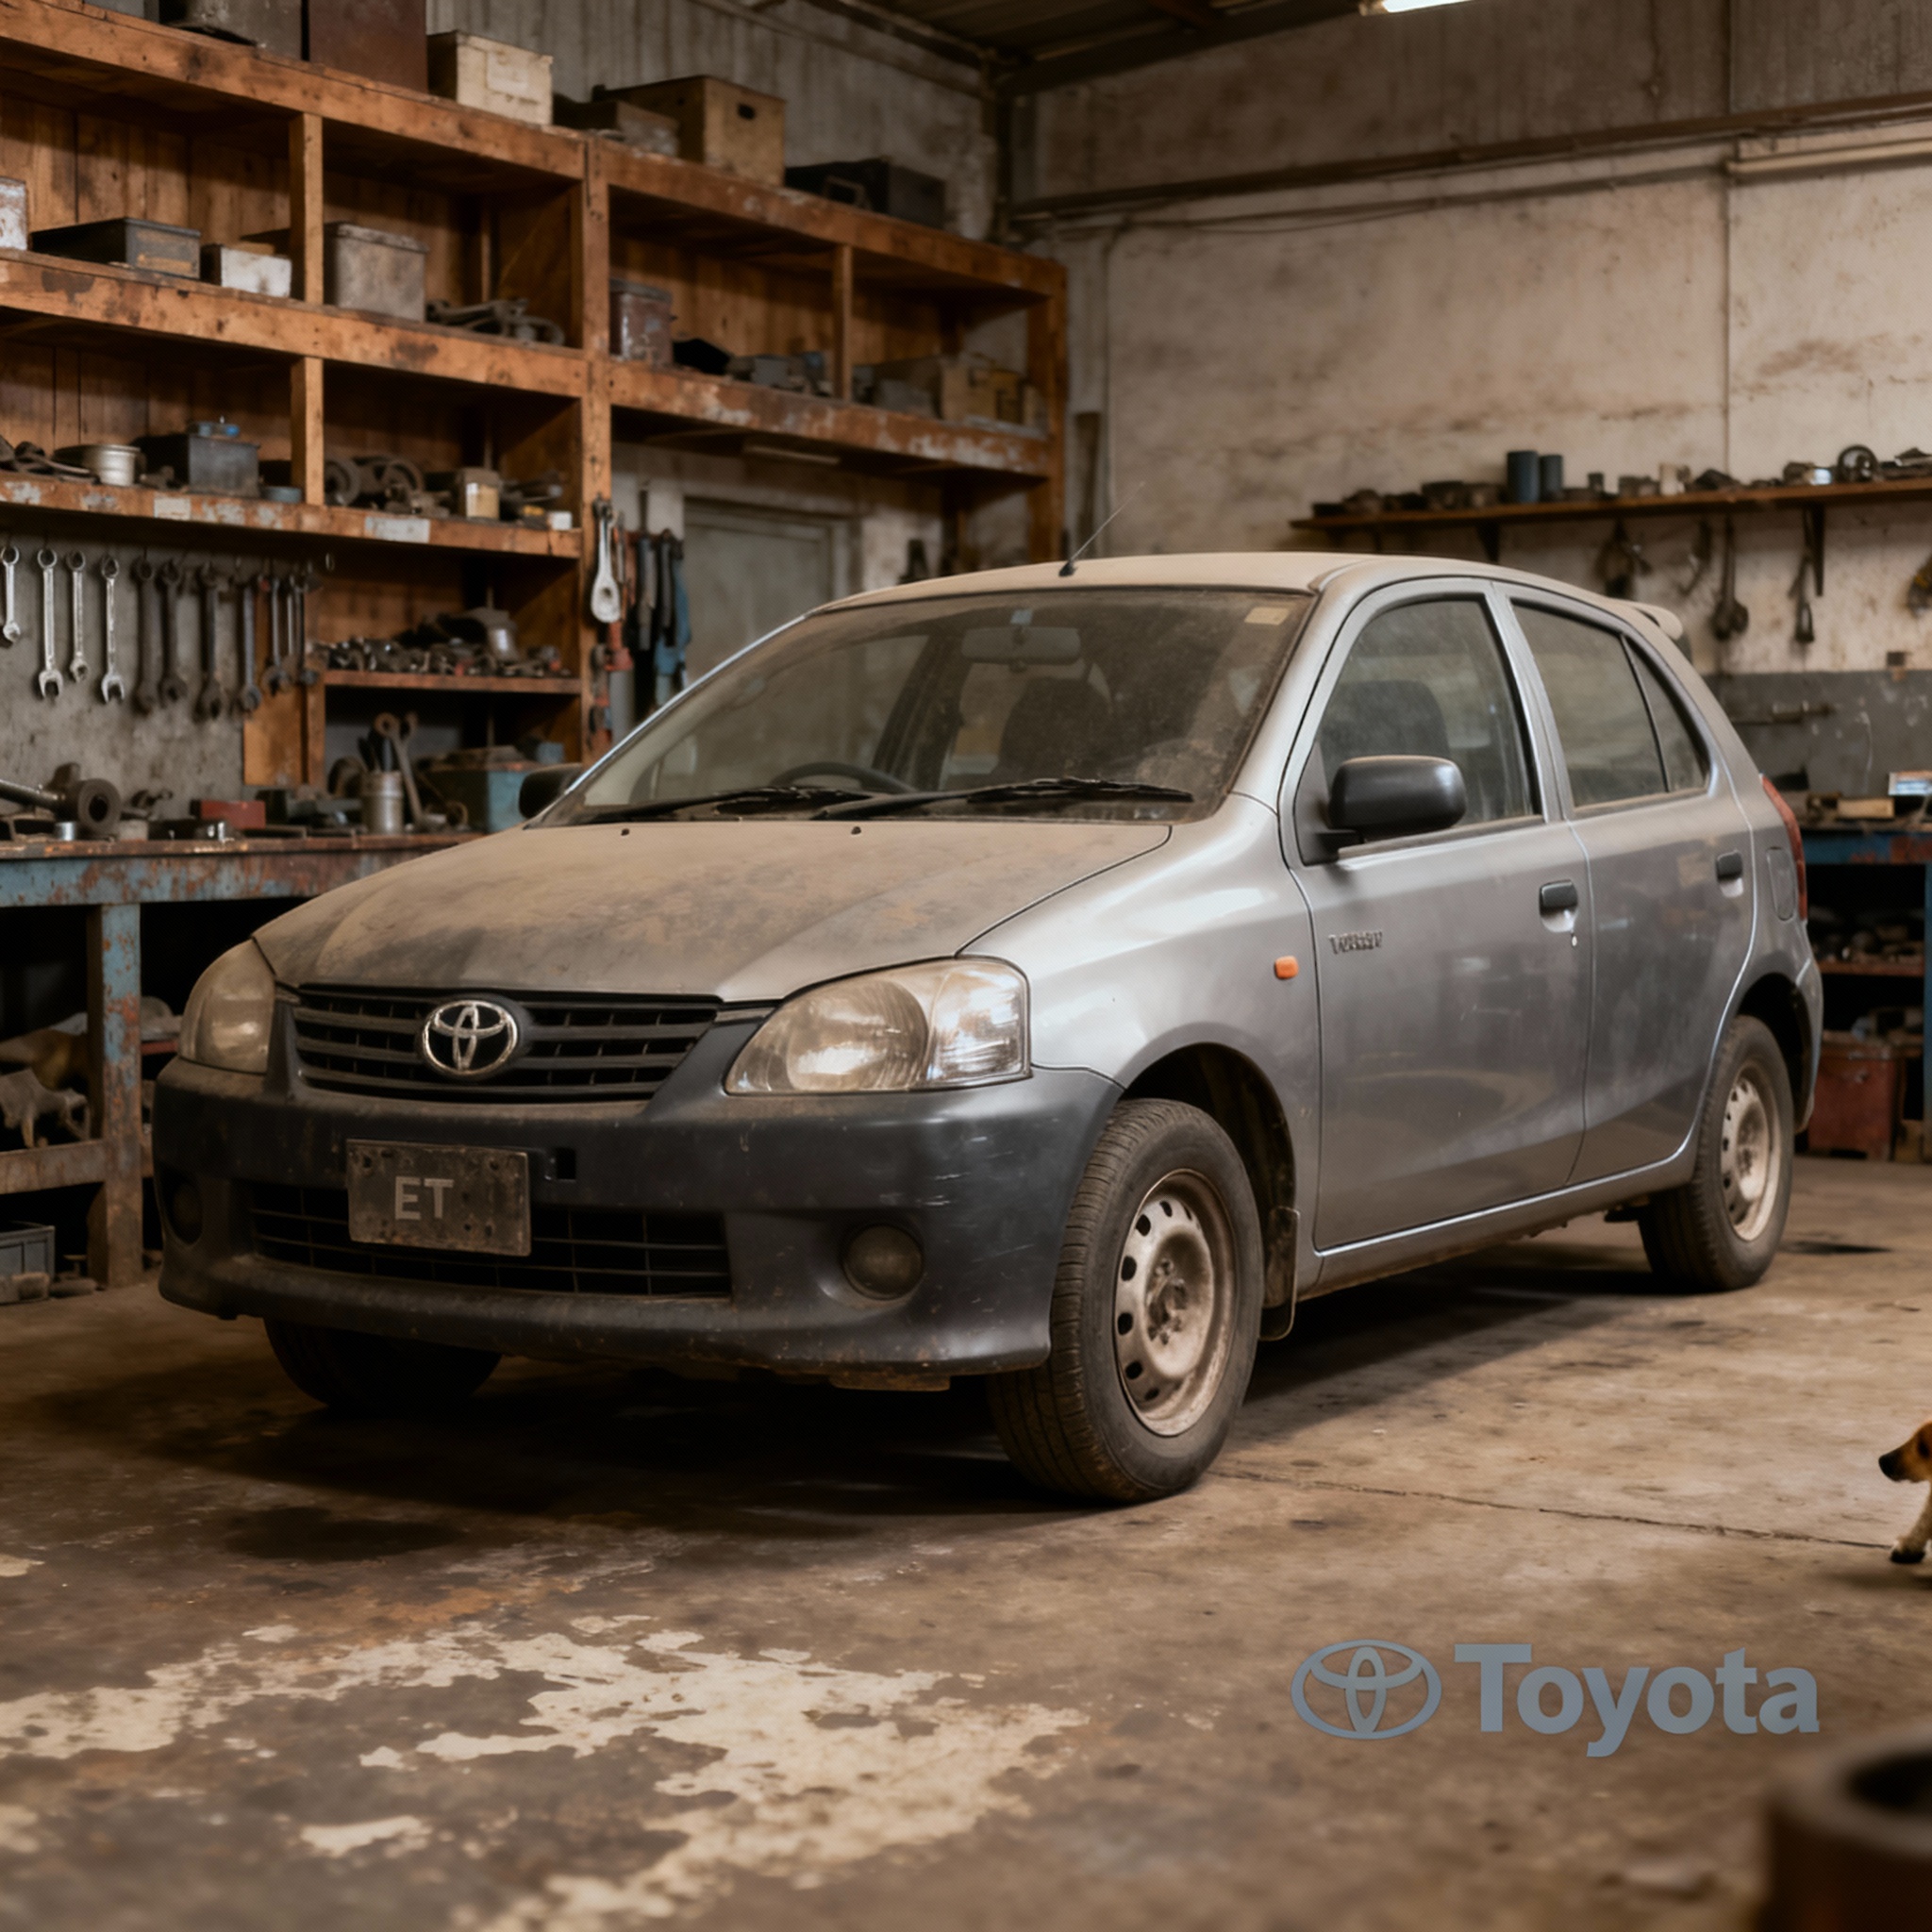
Compact Hatchbacks and Low-End Models
Toyota’s smaller models such as the Etios and Yaris Hatchback have faced intense competition from brands like Hyundai, Kia, and Suzuki in emerging markets.
Consumers are shifting toward SUVs and crossovers, leading to a decline in small hatchback demand.
These models have limited profitability, and Toyota has reduced their production in several regions.
Diesel Passenger Cars
As global regulations tighten around emissions, diesel engines are being phased out in many markets.
Toyota has already reduced its diesel car lineup and is focusing more on hybrids and EVs.
This makes diesel-based passenger cars a declining and low-profit segment for Toyota.
Both these categories fit the Dog quadrant due to declining market relevance and profitability.
Strategic Insights from Toyota’s BCG Matrix
The BCG Matrix of Toyota reveals a well-balanced portfolio where mature divisions sustain profitability while new technologies drive innovation.
The hybrid and SUV segments (Stars) represent the core of Toyota’s growth engine. These divisions align with global consumer preferences for sustainability and performance.
The sedan and financial services divisions (Cash Cows) continue to generate stable cash flow, enabling Toyota to invest in emerging technologies.
The electric and hydrogen segments (Question Marks) showcase Toyota’s long-term commitment to innovation and environmental stewardship.
Meanwhile, the declining diesel and compact car segments (Dogs) highlight Toyota’s shift away from low-margin, outdated technologies.
This balance ensures that Toyota remains profitable today while investing in the future of mobility.
Challenges and Limitations of the BCG Matrix for Toyota
Although the BCG Matrix of Toyota offers strategic clarity, it has certain limitations:
The automotive industry is complex and interconnected; success in one segment often influences another.
Market conditions can shift rapidly due to new regulations, fuel prices, and global supply chain disruptions.
The BCG Matrix focuses mainly on quantitative factors like growth and share, ignoring qualitative aspects such as brand equity, innovation, and sustainability.
Toyota’s long-term investments in hydrogen and EVs might take years to mature, which the BCG model does not fully capture.
Thus, Toyota supplements this model with other strategic frameworks such as SWOT, PESTEL, and Ansoff Matrix for more comprehensive decision-making.
Conclusion
The BCG Matrix of Toyota provides an insightful overview of how the company manages its diverse product portfolio in 2025.
Stars like hybrid vehicles and SUVs continue to drive Toyota’s growth and leadership in sustainable mobility.
Cash Cows like sedans and financial services ensure financial strength and stability.
Question Marks such as EVs and hydrogen fuel cell vehicles represent the company’s innovation-driven future.
Dogs like compact hatchbacks and diesel cars are being phased out as part of Toyota’s strategic transformation.
By maintaining a perfect balance between innovation and profitability, Toyota demonstrates why it remains a global benchmark for excellence in automotive strategy. The Toyota BCG analysis not only highlights the company’s current position but also reflects its readiness to shape the future of mobility through technological advancement and environmental responsibility.
FAQs
What is the BCG Matrix of Toyota?
The BCG Matrix of Toyota categorizes its various business units and product lines based on market growth and relative market share to help guide strategic decision-making.
Which are the Star segments of Toyota?
Toyota’s Star segments include hybrid vehicles and SUVs, which dominate their markets and continue to show high growth potential.
What are the Cash Cows in Toyota’s portfolio?
The sedan division and Toyota Financial Services are Cash Cows, generating consistent profits despite slower growth.
Which divisions are considered Question Marks for Toyota?
The electric vehicle (EV) and hydrogen fuel cell divisions are Question Marks that require further investment to gain market share.
Why are diesel and compact car segments classified as Dogs?
These divisions have low profitability and are declining in market relevance due to environmental regulations and shifting consumer preferences.
A digital marketer with a strong focus on SEO, content creation, and AI tools. Creates helpful, easy-to-understand content that connects with readers and ranks well on search engines. Loves using smart tools to save time, improve content quality, and grow online reach.